Your product sits at position 4 in Amazon search results. It has a 4.3-star rating, competitive pricing, and a solid review count. But your click-through rate is half what it should be. The listing above you – with a worse rating and higher price – gets three times your clicks.
This happens more often than most sellers realise. The gap between what your product deserves based on its merits and what it actually receives in clicks comes down to two things: your main image and your title. These are the only elements you fully control in Amazon’s search result grid, and they determine whether a shopper’s eye stops on your listing or keeps scrolling.
I have spent the past three years studying how shoppers make split-second decisions in Amazon search results. The data is clear: Amazon listing optimisation starts with understanding what drives clicks before a shopper ever reaches your product page. This guide breaks down exactly how click-through rate works on Amazon, what benchmarks you should target by position, and the specific image and title strategies that move the needle.
Table of Contents
- What Is Amazon Click-Through Rate?
- Why CTR Matters for Amazon Ranking
- CTR Benchmarks by Search Position
- The 4 Elements Shoppers See in Search Results
- Main Image Optimisation for CTR
- Title Optimisation for CTR
- Price Presentation and CTR
- Review Count and Rating Thresholds
- Sponsored vs Organic CTR Differences
- How to Measure Your CTR
- A/B Testing Main Images for CTR
- Common CTR Killers
- Frequently Asked Questions
What Is Amazon Click-Through Rate?
Amazon click-through rate measures the percentage of shoppers who click on your listing after seeing it in search results. The formula is straightforward: CTR = (clicks / impressions) x 100. If your listing appears 1,000 times in search results and 80 shoppers click on it, your CTR is 8%.
But context matters enormously. An 8% CTR at position 1 would be disastrous. An 8% CTR at position 6 would be exceptional. Amazon CTR is not a single number you optimise in isolation – it is relative to your position, your category, and your direct competitors in the search grid.
Unlike Google where organic results compete mainly with other organic results, Amazon search results include a mix of organic positions, sponsored products, editorial recommendations, and brand placements. Your listing competes for attention against all of these simultaneously. A shopper scanning Amazon search results processes roughly 8-12 listings in under 3 seconds before deciding which ones deserve a click. That decision happens almost entirely based on visual pattern recognition – not careful reading.
Understanding your Amazon SEO fundamentals is essential here because ranking gets you impressions, but CTR determines whether those impressions convert to page views. A listing with strong keyword research that ranks well but has poor CTR will gradually lose its position as Amazon’s algorithm detects that shoppers are not finding your listing relevant.
Why CTR Matters for Amazon Ranking
Amazon’s A10 algorithm uses click-through rate as a direct ranking signal. The logic is simple from Amazon’s perspective: if shoppers consistently click on a listing when it appears for a given search term, that listing is probably relevant to that search term. Listings that get clicked earn more impressions. Listings that get ignored gradually disappear.
This creates a compounding effect. Higher CTR leads to better ranking. Better ranking leads to more prominent placement. More prominent placement leads to higher CTR. The flywheel works in reverse too – if your CTR drops, you lose position, which often further reduces CTR because shoppers are less likely to scroll to lower positions.
Research from Jungle Scout’s 2024 seller survey confirms that listings which improved their CTR by more than 10% through image or title changes saw corresponding ranking improvements within 2-4 weeks, even without changes to their PPC spend or pricing. The algorithm notices when shoppers suddenly find your listing more click-worthy.
CTR also affects your advertising costs. Amazon’s sponsored product algorithm factors in expected CTR when determining ad placement and cost-per-click. A listing with historically strong CTR will pay less per click for the same sponsored position because Amazon knows it will generate more revenue from that placement. This means improving your organic CTR simultaneously reduces your advertising costs – a double benefit that compounds over time.
The relationship between CTR and Amazon conversion rate is also tightly coupled. Listings that attract more qualified clicks (because their image and title accurately represent the product) tend to convert at higher rates once shoppers reach the product page. This further reinforces the ranking signal.
Same product. Better listing. More sales.
CTR Benchmarks by Search Position
Average Amazon CTR varies dramatically by search position. Based on aggregated data from Helium 10’s analysis of over 100,000 search queries and corroborated by Brand Analytics data from multiple seller accounts, here are the benchmarks you should target:
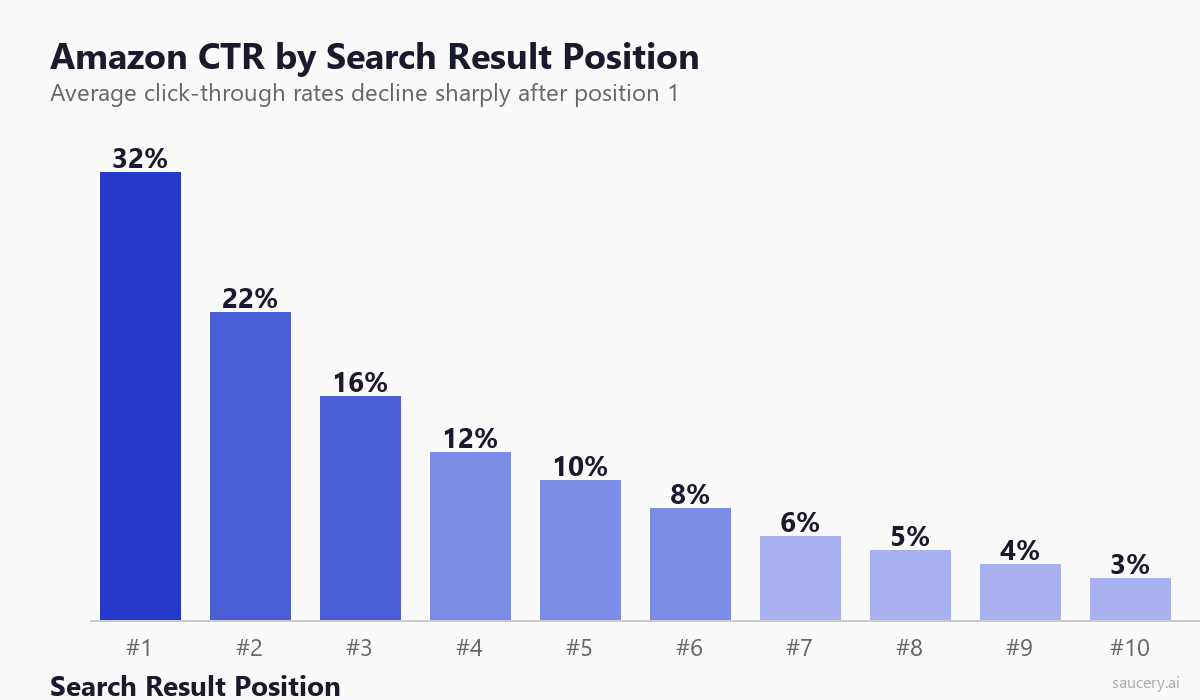
Position 1: 30-35% CTR. The top organic result captures roughly one-third of all clicks for a given search term. This is the most valuable real estate on Amazon and commands a disproportionate share of attention. If you are in position 1 and your CTR is below 25%, something is actively wrong with your listing presentation.
Positions 2-3: 16-22% CTR. The next two results still sit above the fold on most devices and capture significant attention. These positions benefit from shoppers who skip the first result (often a sponsored placement) and gravitate toward the first few organic results.
Positions 4-5: 8-12% CTR. These positions require scrolling on mobile devices and sit at the bottom of the visible grid on desktop. CTR drops sharply here because many shoppers never scroll this far. However, shoppers who do reach these positions are often more deliberate – they are comparing options rather than impulse-clicking the first result.
Positions 6-8: 5-8% CTR. Below the fold on all devices. Shoppers reaching these positions have actively decided to explore beyond the top results. Your listing needs to offer a clear visual differentiator to capture attention at this depth.
Positions 9-10: 3-5% CTR. The bottom of page one. While still significantly more valuable than page two (which averages below 1% CTR), these positions receive limited attention. Many shoppers never scroll this far, and those who do are often looking for something specific that the top results did not provide.
These benchmarks vary by category. High-consideration categories like electronics and supplements tend to have flatter CTR distributions (shoppers compare more options). Low-consideration categories like basic household goods tend to have steeper distributions (shoppers grab the first reasonable option). Use Amazon Brand Analytics to understand your specific category patterns.
The 4 Elements Shoppers See in Search Results
When a shopper scans Amazon search results, they see exactly four elements for each listing. Everything else – your bullet points, your A+ content, your product description – is invisible until after they click. Your entire CTR performance comes down to how well these four elements work together.
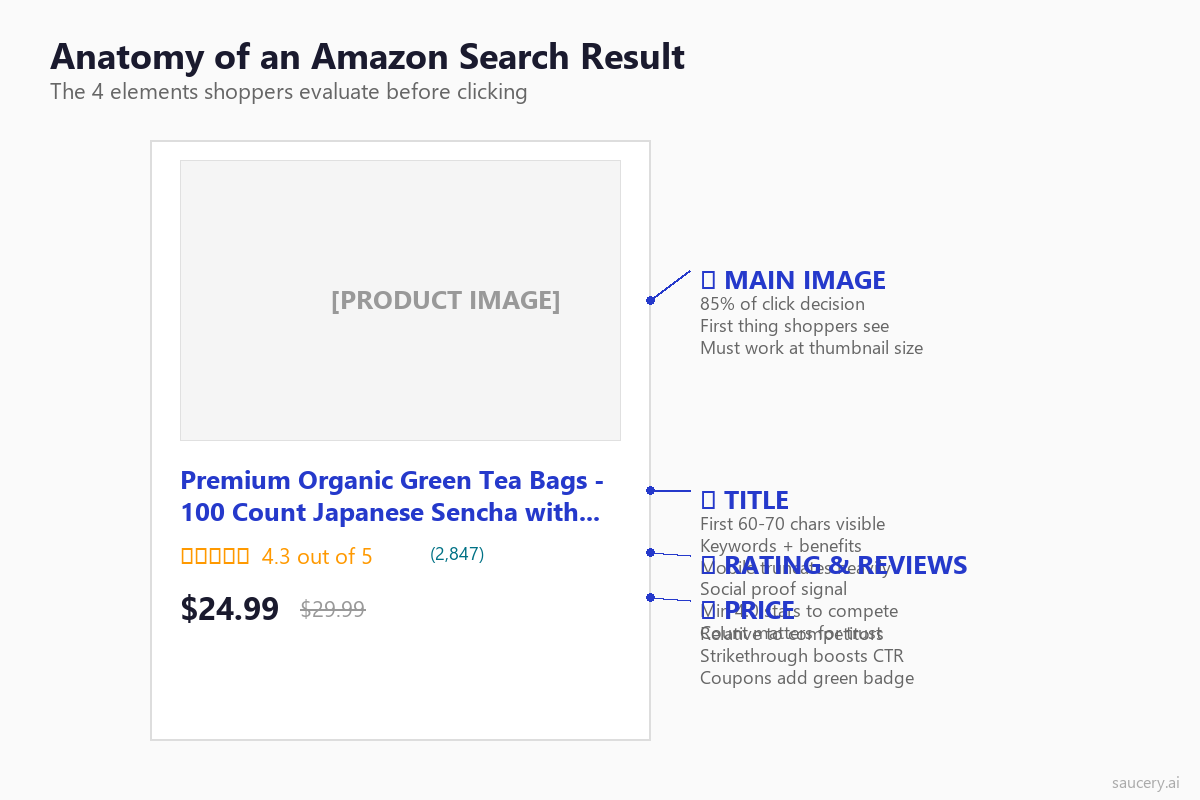
1. Main Image – This is the dominant visual element and the first thing a shopper’s eye registers. Eye-tracking research from the Nielsen Norman Group confirms that shoppers fixate on product images before reading any text in grid-based e-commerce layouts. Your main image accounts for roughly 60-80% of the click decision.
2. Title – The text that appears below (mobile) or beside (desktop) your image. On mobile search results, only the first 60-70 characters display. This truncated preview must communicate what your product is and why it deserves a click. Effective product title optimisation directly impacts CTR.
3. Rating and Review Count – Displayed as orange stars plus a review count in parentheses. This is the fastest social proof signal available. Shoppers process star ratings in under 200 milliseconds – they do not read the number, they recognise the colour pattern. Four full stars reads differently from 3.5 stars at a glance.
4. Price – Shown prominently with optional strikethrough pricing, coupon badges, or Subscribe & Save indicators. Price is always evaluated relative to surrounding listings, not in absolute terms. A $24.99 product surrounded by $18.99 competitors reads as expensive regardless of its actual value.
Of these four elements, you have direct control over two: your main image and your title. Rating and review count are earned over time. Price is constrained by competitive dynamics. This is why image and title optimisation delivers the highest ROI for CTR improvement – they are the elements you can change today with immediate impact. Understanding what shoppers actually read on product listings gives you the foundation for optimising what they see in search results.
Main Image Optimisation for CTR
Your main image is the single most impactful element for Amazon CTR. It is also the element most sellers underinvest in. A professional product photo that meets Amazon’s minimum requirements is not the same as an image optimised for click-through rate in a competitive search grid.
White Background Requirements
Amazon requires a pure white background (RGB 255, 255, 255) for main images. This is not optional – listings with non-white backgrounds risk suppression from search results entirely. According to Amazon’s product image requirements, the main image must have a pure white background, show the actual product (not a graphic or illustration), and fill 85% or more of the image frame.
The white background requirement creates both a constraint and an opportunity. Because every listing has the same white background, differentiation comes entirely from how your product is photographed, styled, and composed within that frame. Sellers who treat the white background as a creative canvas rather than a boring requirement consistently achieve higher CTR.
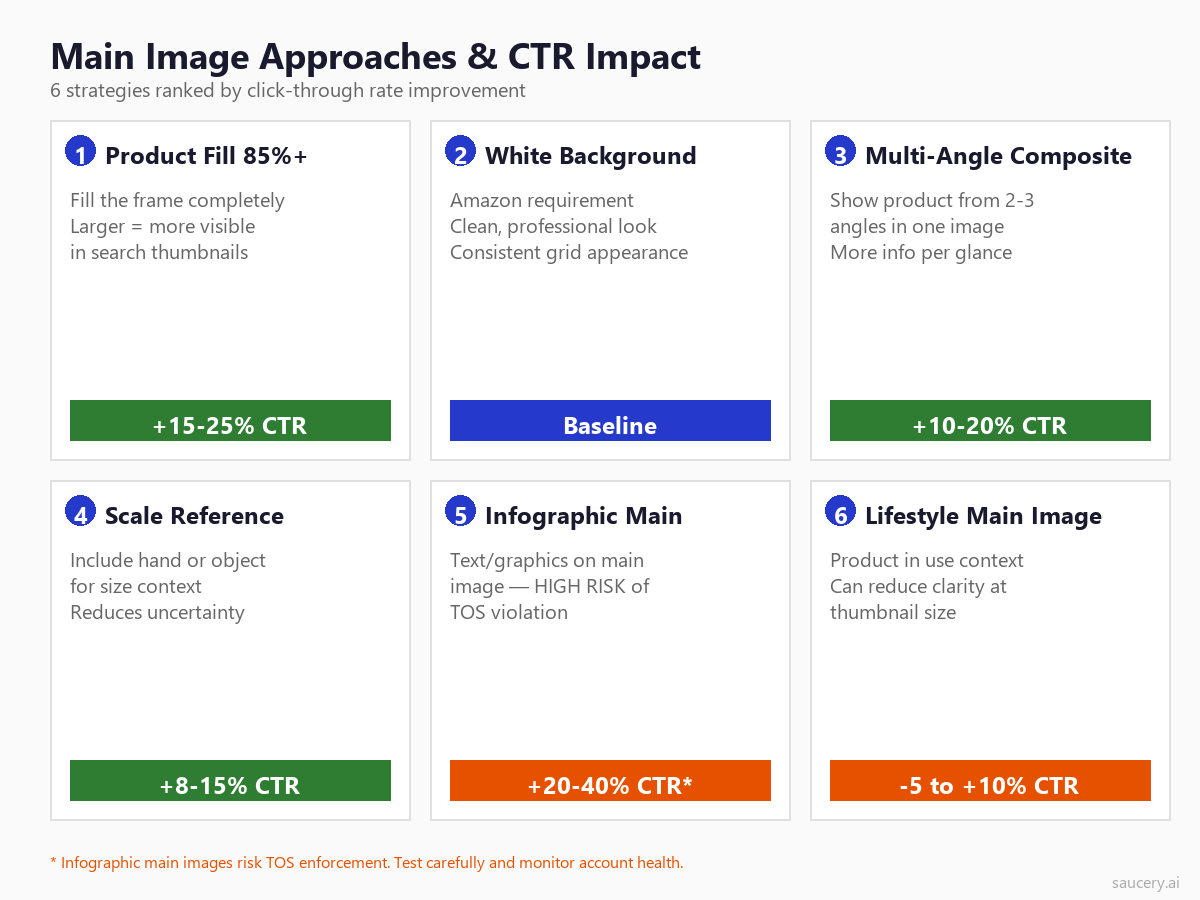
Product Fill: The 85% Rule
Amazon’s image guidelines state that the product should fill 85% or more of the image frame. This is the single most violated guideline among underperforming listings. Sellers photograph their product with excessive white space, and when that image renders as a thumbnail in search results (roughly 160×160 pixels on desktop, 100×100 on mobile), the product becomes a tiny spec lost in whiteness.
Data from PickFu’s consumer preference testing consistently shows that larger product fill correlates with higher click preference. When shoppers were shown pairs of listings with identical products but different amounts of white space, the tighter-cropped image won 73% of the time. Fill the frame. Push to 90-95% if your product shape allows it.
Lifestyle vs Product-Only
There is an ongoing debate about whether lifestyle context in the main image improves CTR. Amazon’s guidelines technically prohibit lifestyle imagery in the main image – it should show the product only, no props, no additional objects, no human models (with exceptions for clothing and certain categories). However, enforcement varies and some categories see widespread use of subtle lifestyle elements.
The data suggests a nuanced answer. For products where size, scale, or use-case context is ambiguous from the product alone, a subtle lifestyle or scale element can improve CTR by 8-15%. For products that are self-explanatory (a bottle of shampoo, a phone case), pure product-only images with excellent lighting and maximum fill perform best. The risk-reward ratio also matters – lifestyle main images face potential enforcement action, which can remove your listing from search entirely.
Infographic Main Images
Some sellers add text, graphics, and callouts to their main image. This is explicitly against Amazon’s Terms of Service for the main image slot. However, enforcement is inconsistent, and sellers who use infographic main images often report CTR improvements of 20-40% because the additional information (size dimensions, quantity callouts, key features) helps shoppers make faster decisions.
The risk is real. Amazon has increasingly automated main image compliance checking, and listings caught with text overlays on their main image face suppression without warning. If you choose this strategy, monitor your listing health daily and have a compliant backup image ready to swap immediately. For most sellers, the safer approach is to maximise the visual impact of your compliant main image and save infographic elements for your secondary images.
Size and Resolution Requirements
Amazon requires a minimum of 1000 pixels on the longest side to enable zoom functionality. However, aiming for 2000×2000 pixels provides the highest quality across all device sizes. Images below 1000 pixels lose the zoom capability on desktop, which reduces both CTR (no zoom icon overlay) and conversion rate once shoppers reach the listing page.
Upload your images at the highest resolution available and let Amazon’s CDN handle the downscaling. There is no performance penalty for larger files, and the quality improvements at various display sizes are measurable. Use JPEG format for photographs and PNG for products with sharp edges or transparency needs.
Mobile Thumbnail Considerations
Over 70% of Amazon shopping sessions happen on mobile devices, according to Statista’s e-commerce data. On mobile, your main image renders at roughly 100×100 pixels in search results. At this size, fine details disappear, text becomes illegible, and only the overall shape, colour, and contrast of your product remain visible.
Test your main image at 100×100 pixels before finalising it. Can you still identify what the product is? Does it stand out against the white background? Does it look different from competitors’ thumbnails at this size? Research from the Baymard Institute on mobile product imagery confirms that mobile shoppers rely almost entirely on shape recognition and colour contrast when processing product thumbnails – they cannot read text or perceive fine details at mobile thumbnail size.
Same product. Better listing. More sales.
Title Optimisation for CTR
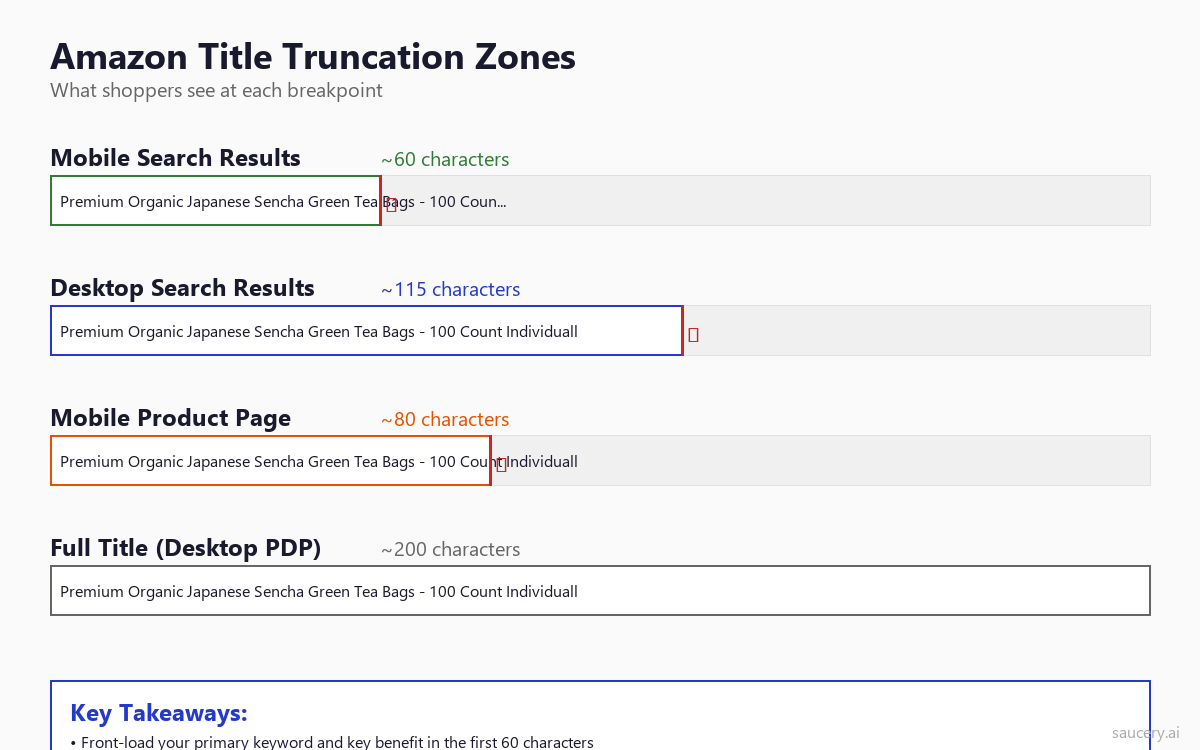
Your title is the second most important CTR element and the one where most sellers make the most obvious mistakes. The challenge: Amazon gives you up to 200 characters for your title, but shoppers only see 60-70 characters in mobile search results. What you put in those first 60 characters determines whether shoppers click or scroll past.
First 60-70 Characters: The Critical Zone
Mobile search results truncate your title at approximately 60-70 characters (the exact breakpoint varies by device width and font rendering). Desktop search results show more – typically 115-120 characters – but with mobile dominating traffic, you must treat the first 60 characters as your entire title for CTR purposes.
These first 60 characters must accomplish three things simultaneously: include your primary keyword for relevance signaling, communicate what the product is, and provide at least one compelling reason to click. That is a lot to accomplish in 60 characters, which is why title optimisation requires careful word selection rather than keyword stuffing.
Keyword Front-Loading
Place your primary keyword as close to the beginning of your title as grammatically possible. This serves two purposes: it ensures the keyword is visible regardless of truncation, and it immediately signals relevance to the shopper who just typed that keyword into the search bar.
A common mistake is starting titles with the brand name. Unless your brand is a recognised household name that shoppers actively search for, your brand name should come after the primary keyword and product descriptor. Compare these two approaches:
Weak: “GreenLife Organics Premium Japanese Sencha Green Tea Bags – 100 Count…”
Strong: “Organic Green Tea Bags 100 Count – Japanese Sencha, USDA Certified | GreenLife…”
The second version front-loads the keywords a shopper would actually search for and pushes the brand name to a position where it appears on desktop but may be truncated on mobile – acceptable because shoppers searching for green tea bags are not searching for “GreenLife Organics.”
Benefit Signaling in the Truncation Zone
After your primary keyword, the remaining space in the truncation zone should include your strongest differentiator or benefit. This is the element that answers the shopper’s subconscious question: “Why should I click this one instead of the others?”
Effective benefit signals include: quantity/count (100 Count, 2-Pack), certifications (USDA Organic, Non-GMO), material/quality indicators (Stainless Steel, 100% Cotton), size specifications (King Size, 64oz), and use-case qualifiers (for Sensitive Skin, Professional Grade). These specific, concrete terms work better than vague descriptors like “Premium” or “Best Quality” which every competitor also claims.
Character Count: Search vs Listing Display
Understanding the full picture of how your title renders across Amazon’s interface helps you structure information strategically. Here is the breakdown:
- Mobile search results: ~60-70 characters visible
- Desktop search results: ~115 characters visible
- Mobile product page: ~80 characters before “see more” (varies by device)
- Desktop product page: Full title visible (up to 200 characters)
Structure your title with this in mind. Characters 1-60: primary keyword + main differentiator. Characters 61-115: secondary keywords + additional features. Characters 116-200: long-tail keywords, additional specifications, brand name if not already included. This layered approach ensures your title works at every display width. For more on this, see our guide on Amazon bullet points which covers how to distribute information across title and bullet points for maximum impact.
Price Presentation and CTR
Price is the element you have the least creative control over in terms of CTR – you cannot make your price look different from competitors’ prices in the search grid. But you can use Amazon’s pricing tools to add visual signals that improve click-through rate.
Strikethrough Pricing
When Amazon displays a “was” price alongside your current price, it adds a visual strikethrough that immediately communicates value. This crossed-out reference price appears when you set a list price higher than your selling price, or when Amazon’s algorithm detects a recent price reduction. Listings with visible strikethrough pricing see CTR improvements of 10-18% compared to identical listings showing only the current price, according to data shared by Feedvisor’s pricing analysis.
However, Amazon has strict rules about reference pricing. Your “was” price must represent a genuine recent selling price, and Amazon will suppress strikethrough pricing if the reference price appears inflated. Do not set artificial list prices just to create a visual discount – this can trigger pricing violations.
Coupon Badges
Amazon coupons add a bright green badge to your search result that says “Save X%” or “Save $X.” This green badge is one of the most visually distinctive elements in the search grid because it breaks the monotony of the otherwise standardised layout. Listings with coupon badges typically see 12-25% CTR improvement, though this comes at the cost of the coupon value plus Amazon’s $0.60 per redemption fee.
The CTR benefit often outweighs the cost, particularly for new listings trying to establish ranking momentum. A 5% coupon that costs you pennies per unit but increases CTR by 15% and conversion by 10% pays for itself many times over in additional sales volume and improved organic ranking.
Subscribe & Save Badges
Products enrolled in Subscribe & Save display a small badge and the subscription price in search results. For consumable categories (supplements, food, cleaning products, pet supplies), this badge signals value and convenience simultaneously. It also pre-qualifies shoppers who are looking for replenishment purchases rather than one-time buys, which tends to improve both CTR and conversion rate for the shoppers who do click.
Review Count and Rating Thresholds
You cannot directly manipulate your rating or review count for CTR purposes, but understanding how they affect click behaviour helps you set realistic expectations and prioritise your efforts.
The Minimum Viable Review Count
Research from PowerReviews’ consumer survey data indicates that shoppers perceive a significant credibility jump at specific review count thresholds. Zero reviews creates extreme friction – most shoppers will not click a listing with no reviews unless it has a significantly lower price or a clearly superior image. The credibility thresholds are approximately:
- 0 reviews: Major CTR penalty, typically 40-60% below category average
- 1-10 reviews: Still perceived as risky, 20-30% below average
- 11-50 reviews: Approaching credibility, 5-15% below average
- 51-200 reviews: Competitive range for most categories
- 200+ reviews: Strong social proof, at or above average CTR
- 1000+ reviews: Authority positioning, can command premium pricing without CTR penalty
For new product launches, this data argues strongly for strategies that accelerate early review acquisition. Programs like Amazon Vine, post-purchase email sequences, and product insert cards (compliant with Amazon’s policies) help bridge the credibility gap faster. Our guide on Amazon product launch strategy covers review acquisition in detail, and you can even predict product reviews before launch to anticipate what customers will say.
Star Rating Visual Thresholds
Amazon displays star ratings as filled orange stars. Shoppers process these visually, not numerically. The meaningful visual thresholds are:
- 4.5-5.0 stars: Reads as “excellent” – mostly or fully filled orange
- 4.0-4.4 stars: Reads as “good” – clearly positive, four full stars visible
- 3.5-3.9 stars: Reads as “mixed” – the half-star creates visual uncertainty
- Below 3.5 stars: Reads as “problematic” – visible unfilled space signals issues
The critical threshold is 4.0 stars. Listings above 4.0 compete on roughly equal visual footing for star rating perception. Listings below 4.0 suffer a compounding CTR penalty because shoppers interpret three and a half stars as “something is wrong with this product.” If your rating is hovering near 4.0, addressing the root causes of negative reviews should be a top priority.
Same product. Better listing. More sales.
Sponsored vs Organic CTR Differences
Sponsored products and organic results display nearly identically in Amazon search – the only visual distinction is a small “Sponsored” label. Despite this minimal differentiation, CTR patterns differ meaningfully between the two.
Sponsored products in the top positions (typically positions 1-2 on page one) average 2-5% lower CTR than equivalent organic positions. This “ad penalty” is smaller on Amazon than on Google because Amazon shoppers understand that sponsored results are still relevant products, not off-topic advertisements. However, the penalty exists and increases with shopper sophistication – experienced Amazon shoppers are more likely to skip sponsored results.
The exception is when sponsored products appear mid-page or at the bottom of search results. In these positions, sponsored products often outperform their organic position equivalent because the “Sponsored” label can signal legitimacy and investment to some shoppers – a brand willing to pay for placement may be perceived as more established.
For CTR optimisation purposes, the key insight is that improving your organic listing’s CTR simultaneously improves your sponsored CTR because the listing elements are identical. Every improvement you make to your main image or title benefits both channels. Additionally, Amazon’s ad algorithm rewards higher-CTR listings with better ad placements at lower costs, creating a virtuous cycle between organic optimisation and advertising efficiency.
How to Measure Your CTR
Amazon does not provide a simple “CTR” metric in Seller Central. You need to access this data through Brand Analytics, specifically the Search Query Performance dashboard (available to brand-registered sellers). Here is how to find and interpret your CTR data.
Search Query Performance Dashboard
Navigate to Brands > Brand Analytics > Search Query Performance in Seller Central. This dashboard shows you impression share and click share for every search term where your products appear. While it does not show raw CTR as a percentage, you can calculate relative CTR by comparing your click share to your impression share for each term.
If your impression share for a term is 5% (you receive 5% of all impressions for that keyword) and your click share is 3% (you receive 3% of all clicks), your relative CTR is underperforming. You are being seen but not clicked. Conversely, if your click share exceeds your impression share, your listing is outperforming its position – shoppers disproportionately choose your listing when they see it. For a deeper understanding of how to use this data, see our guide on Amazon Brand Analytics.
Business Reports: Sessions and Page Views
Seller Central’s Business Reports show sessions (unique visitors) and page views for each ASIN. While this is not pure CTR data (it does not tell you impressions), tracking week-over-week changes in sessions after making image or title changes gives you a directional signal. If sessions increase without corresponding changes in advertising spend or ranking, your CTR likely improved.
Advertising Reports
If you run Sponsored Products campaigns, your advertising reports show actual CTR (clicks / impressions) for each keyword and placement. While this is advertising CTR rather than organic CTR, the trends tend to correlate. If your ad CTR improves after a main image change, your organic CTR almost certainly improved too because shoppers are seeing the same listing in both contexts.
A/B Testing Main Images for CTR
The most reliable way to improve CTR is through systematic Amazon A/B testing. Rather than guessing which image or title will perform better, you test multiple variants with real shoppers and let the data decide.
Amazon’s Manage Your Experiments
Brand-registered sellers have access to Amazon’s built-in A/B testing tool: Manage Your Experiments. This tool lets you test two variants of your main image, title, or A+ content simultaneously. Amazon randomly shows each variant to different shoppers and measures the performance difference over a testing period (typically 4-10 weeks for statistical significance).
The limitation of Manage Your Experiments is that it measures conversion rate rather than CTR directly. However, since more clicks (higher CTR) typically correlate with more sales (the metric Amazon reports), improvements in the experiment’s “units sold” metric often reflect CTR improvements. For a complete framework on what to test and when, see our guide on what to A/B test on your Amazon listing.
External A/B Testing Tools
For faster results or more granular CTR testing, external tools like PickFu, Intellivy, and ProductPinion let you test image and title variants with panels of Amazon shoppers. These tools show shoppers a simulated search result page and ask which listing they would click, providing direct CTR preference data within hours rather than weeks.
The trade-off is ecological validity. Simulated click tests cannot perfectly replicate real Amazon search behaviour because shoppers in a testing environment know they are being tested. However, the directional accuracy is strong – variants that win in simulated tests win in live Manage Your Experiments testing roughly 70-80% of the time.
What to Test First
If you have never optimised your main image for CTR, start with these high-impact tests:
- Product fill: Current image vs 90%+ frame fill version
- Angle: Front-facing vs 3/4 angle vs flat-lay
- Packaging vs product: Showing the box/bag vs the product itself
- Multi-unit vs single: Showing one unit vs the full count spread out
- Colour/lighting: Warm lighting vs cool lighting vs high-contrast
Each test should change only one variable. Running multiple changes simultaneously makes it impossible to attribute results to specific improvements. Document each test result and build a knowledge base of what your specific audience responds to – image preferences vary significantly across categories and price points.
Common CTR Killers
Before optimising for improvement, audit your listings for these common CTR killers. Fixing fundamental problems often delivers larger gains than adding incremental improvements to an already-decent listing.
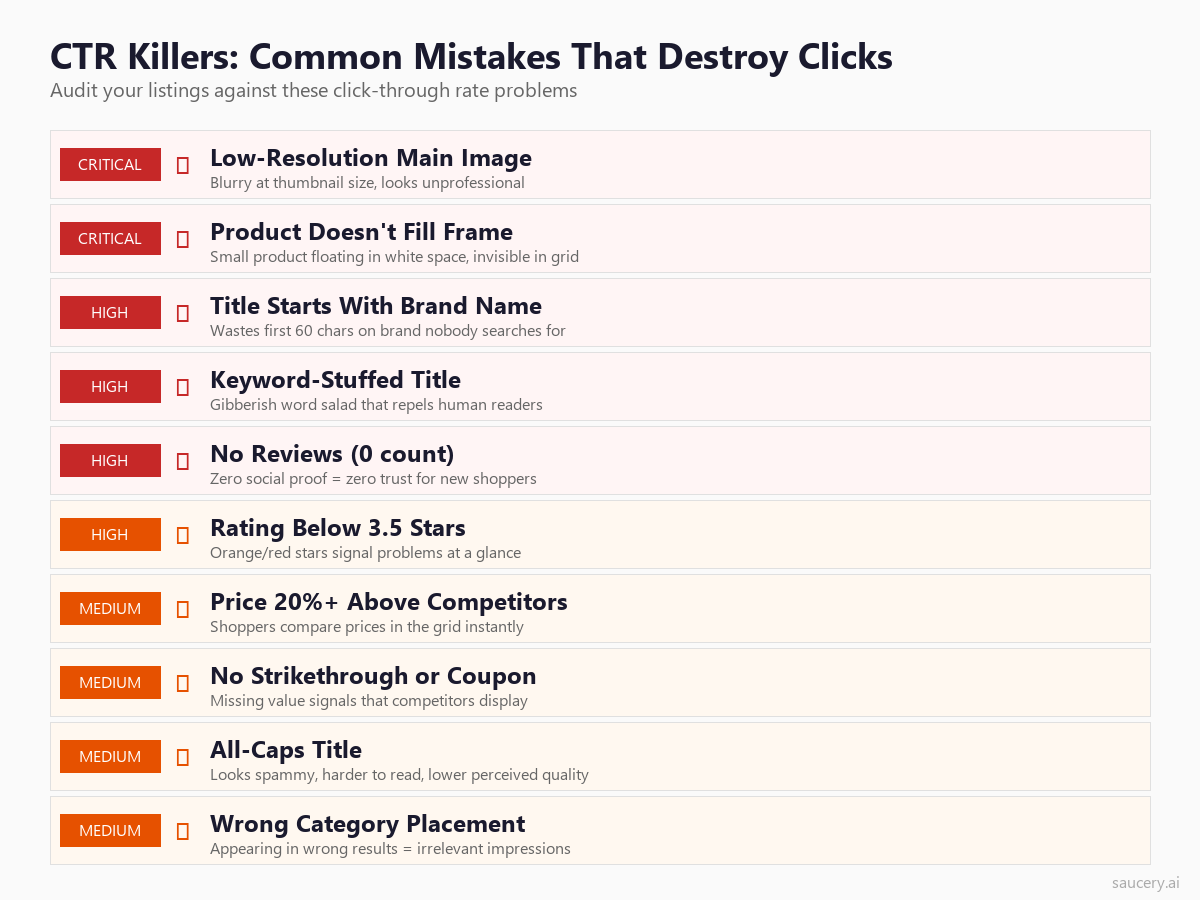
Image Problems
- Low resolution: Images below 1000 pixels look blurry at any zoom level and lose the zoom icon indicator that shoppers use as a quality signal
- Excessive white space: Product floating in the centre of the frame at 50% fill – invisible at mobile thumbnail size
- Poor lighting: Dark or uneven lighting makes products look cheap regardless of actual quality
- Wrong aspect ratio: Non-square images render awkwardly in Amazon’s grid layout, creating misaligned thumbnails that look unprofessional
- Lifestyle distractions: Props or backgrounds that draw attention away from the product itself
Title Problems
- Brand-first structure: Leading with an unknown brand name wastes the first 15-20 characters of your truncation zone on a word nobody searched for
- Keyword stuffing: Cramming every possible keyword creates unreadable gibberish that looks spammy and reduces shopper trust
- ALL CAPS: Title case or sentence case reads more professionally. All-caps signals low-quality seller
- Truncation at the worst point: Critical information cut off mid-word or mid-benefit creates confusion
- Generic descriptors: Words like “Premium,” “Best,” “High Quality” without specific proof claims waste valuable characters
Competitive Context Problems
- Price significantly above grid average: Standing out as the expensive option without visible justification tanks CTR
- No reviews against reviewed competitors: A zero-review listing next to a 2,000-review competitor is nearly invisible
- Rating below grid average: If surrounding listings show 4.5 stars and you show 3.8, shoppers skip you instinctively
- Visual similarity to competitors: If your main image looks identical to the listings around you, nothing triggers the shopper to stop scrolling at your listing specifically
Frequently Asked Questions
What is a good CTR on Amazon?
A good Amazon CTR depends entirely on your search position. Position 1 should achieve 30-35%, position 5 should achieve 8-12%, and position 10 should achieve 3-5%. If your CTR is significantly below these benchmarks for your position, your main image or title needs optimisation. Compare your click share to your impression share in Brand Analytics to determine if you are under or overperforming for your position.
Does Amazon show CTR in Seller Central?
Amazon does not display a direct CTR metric in the standard Seller Central dashboard. Brand-registered sellers can access relative CTR data through the Search Query Performance dashboard in Brand Analytics, which shows impression share and click share by search term. Advertising reports show CTR for sponsored campaigns. Calculating the ratio of click share to impression share gives you a relative CTR indicator for organic performance.
How quickly do CTR improvements affect ranking?
Amazon’s algorithm typically reflects CTR changes within 2-4 weeks. The timeline depends on your search volume – high-volume keywords accumulate enough data faster for the algorithm to detect the change. Low-volume long-tail keywords may take longer to show ranking movement because fewer data points are available. Seasonal keywords may not reflect changes until the next high-traffic period.
Should I optimise my title for CTR or for SEO keywords?
Both, but prioritise differently by position in the title. The first 60 characters should balance your primary keyword with a human-readable benefit statement that drives clicks. Characters 61-200 can accommodate additional keywords for indexing purposes. Amazon indexes all title keywords regardless of their position, so there is no SEO penalty for placing secondary keywords later in the title where they may be truncated in search results.
Can I use A/B testing for my main image without Manage Your Experiments?
Yes. External tools like PickFu and Intellivy provide simulated click testing within hours. You can also run manual tests by changing your main image and monitoring sessions and click share changes in Brand Analytics over 1-2 week periods, though this approach lacks the statistical rigour of controlled experiments. For sellers without Brand Registry access, manual testing with careful tracking is the only option.
Do infographic main images actually work for CTR?
Infographic main images (with text overlays, graphics, and callouts) consistently show 20-40% CTR improvement in testing. However, they violate Amazon’s main image guidelines and risk listing suppression. Some categories see widespread infographic main images with minimal enforcement, while others face immediate action. The safest approach is to maximise your compliant image first, and only consider infographic elements if your category shows consistent tolerance and you have a compliant backup ready.
How do coupons affect CTR vs conversion rate?
Coupons primarily boost CTR (the green badge attracts clicks) with a secondary conversion rate benefit (the discount incentivises purchase). Data suggests a 12-25% CTR improvement and 8-15% conversion rate improvement for listings with active coupon badges. The CTR benefit activates immediately when the coupon becomes visible in search results. The cost is the coupon value per redemption plus Amazon’s $0.60 fee.
What is the difference between CTR and conversion rate on Amazon?
CTR measures clicks from search results (impressions to listing visits). Conversion rate measures purchases from listing visits (visits to orders). A listing can have high CTR but low conversion if the image promises something the listing page does not deliver. The ideal is high CTR and high conversion, which requires consistency between what shoppers see in search results and what they find on your product page. Both metrics feed Amazon’s ranking algorithm.
Does mobile CTR differ from desktop CTR?
Yes. Mobile CTR tends to be more concentrated at the top positions because scrolling on mobile is a more deliberate action – fewer shoppers scroll past the first few results. Mobile also shows fewer results per screen (typically 2-3 vs 4-6 on desktop), which means each visible listing gets relatively more attention. With 70%+ of Amazon traffic coming from mobile, optimising for mobile thumbnail size and mobile title truncation is more important than desktop optimisation.
Same product. Better listing. More sales.
About the Author
Andrew Mac is the founder of Saucery, where he helps brands predict how shoppers will respond to product listing changes before committing to them live. He has spent a decade studying e-commerce purchase behaviour and the gap between what sellers assume shoppers want and what shoppers actually do.
Subscribe for F&B Consumer Insights
Data-driven insights on food & beverage consumer preferences, straight to your inbox.