Amazon Brand Analytics is the single most underused free tool available to Brand Registered sellers. It gives you actual Amazon search data – not estimates from third-party tools, not extrapolations from advertising reports, but the real numbers behind how shoppers search, click, and buy on the platform.
Most sellers glance at it once, feel overwhelmed by the data, and go back to guessing which keywords matter. That is a mistake. The sellers who check Brand Analytics weekly and act on what they find consistently outperform those who rely on gut feeling or outdated keyword lists.
This guide covers everything you need to turn Brand Analytics data into concrete Amazon listing optimisation decisions – from understanding each report, to spotting opportunities, to building a repeatable weekly workflow that compounds over time.
Table of Contents
- What Is Amazon Brand Analytics?
- How to Access Brand Analytics
- Search Query Performance Dashboard
- Top Search Terms Report
- Search Funnel Metrics Explained
- Click Share and Conversion Share
- Finding Keyword Opportunities
- Using Search Data to Optimise Your Title
- Market Basket Analysis
- Repeat Purchase Behaviour
- Demographics Data
- Limitations of Brand Analytics
- Combining Brand Analytics with Third-Party Tools
- Weekly Brand Analytics Review Process
- Turning Data into Listing Changes
- FAQ
What Is Amazon Brand Analytics?
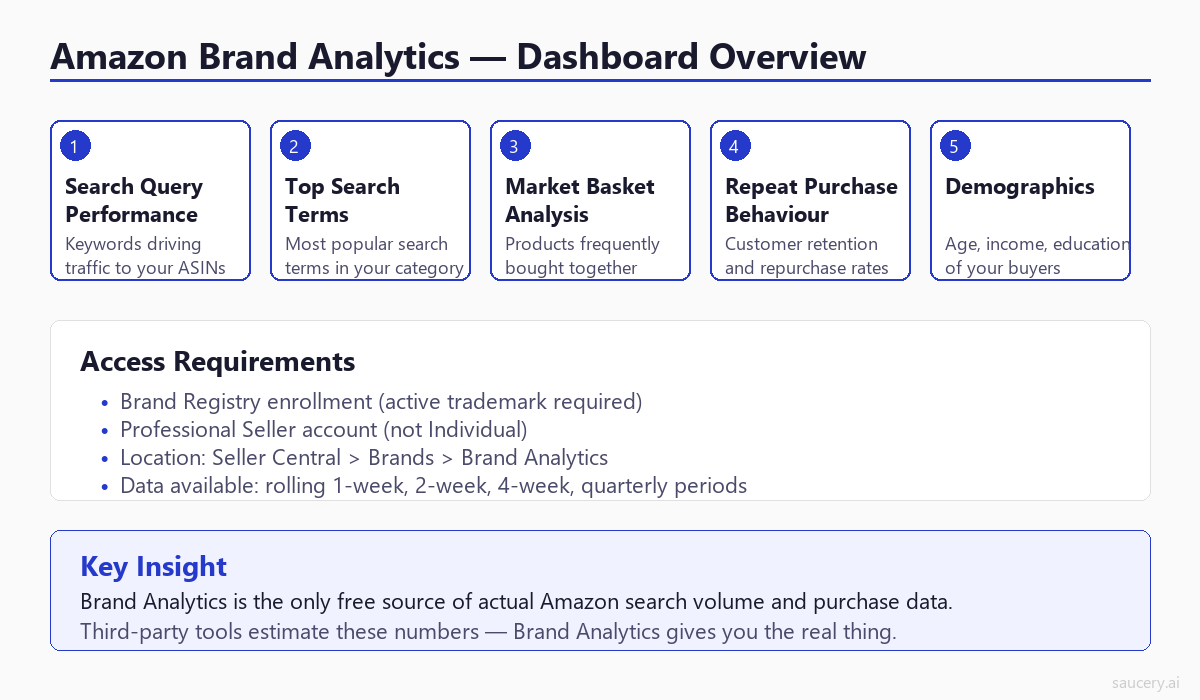
Amazon Brand Analytics is a free analytics suite available to sellers enrolled in Amazon Brand Registry. It provides aggregated data about customer search behaviour, purchasing patterns, and demographics that was previously only available to Amazon’s own retail teams.
Unlike third-party tools such as Helium 10 or Jungle Scout that estimate search volumes using reverse engineering and sampling, Brand Analytics draws from Amazon’s actual search and purchase data. When it tells you a keyword has a certain click share or conversion share, those numbers come from real transactions – not models.
The platform includes five core reports:
- Search Query Performance – How your specific ASINs perform for specific search terms
- Top Search Terms – The most popular search terms in your category (with relative ranking)
- Market Basket Analysis – What products customers buy together with yours
- Repeat Purchase Behaviour – How often customers come back to buy again
- Demographics – Age, household income, education, gender, and marital status of your buyers
Each report answers different questions about your business. But they all feed into the same goal: understanding what shoppers actually do so you can make better decisions about your Amazon SEO strategy, listing content, and product positioning.
How to Access Brand Analytics
Accessing Brand Analytics requires two things: a Professional Seller account (not an Individual account) and active Brand Registry enrollment. Here is exactly how to find it and what you need.
Requirements
- Professional Seller account – The $39.99/month plan. Individual accounts do not have access regardless of Brand Registry status.
- Active Brand Registry enrollment – You need a registered trademark (word mark or design mark) that has been accepted into Amazon’s Brand Registry programme. Pending applications do not grant access.
- Brand ownership or authorisation – You must be listed as the brand owner or an authorised agent in Brand Registry.
Where to Find It in Seller Central
Navigate to Seller Central and follow this path: Main menu > Brands > Brand Analytics. On some accounts, it appears under Main menu > Reports > Brand Analytics. If you do not see either option, your Brand Registry enrollment may not be fully active – check your Brand Registry dashboard for any pending verification steps.
Once inside, you will see a navigation bar across the top with each report type. The default view is typically Search Query Performance, which is also the most actionable report for Amazon keyword research and listing optimisation.
Reporting Periods
Brand Analytics offers four reporting periods: weekly, bi-weekly (two weeks), monthly, and quarterly. The weekly view gives you the most granular data for spotting trends and measuring the impact of listing changes. Monthly and quarterly views smooth out noise but lag behind by several weeks.
Data typically appears with a 3-7 day lag from the end of the reporting period. If you are looking at the most recent week, expect it to become available by mid-week the following week.
Search Query Performance Dashboard
The Search Query Performance (SQP) dashboard is the most powerful report in Brand Analytics for listing optimisation. It shows you exactly which search terms are driving traffic to your products – and crucially, where you are losing shoppers in the funnel.
The SQP report ties specific search queries to your brand’s performance metrics at each stage of the customer journey: impressions, clicks, cart adds, and purchases. This is fundamentally different from the Top Search Terms report (which shows category-wide data) – SQP shows your brand’s performance specifically.
Key Columns in the SQP Report
- Search Query – The exact term shoppers typed
- Search Query Volume – Total number of times this term was searched in the period
- Impressions – How many times your products appeared in results for this term
- Impression Share – Your impressions as a percentage of total impressions for this term
- Clicks – How many times shoppers clicked through to your products
- Click Share – Your clicks as a percentage of total clicks for this term
- Cart Adds – How many times shoppers added your products to cart
- Purchases – How many times shoppers bought your products from this search term
- Conversion Share – Your purchases as a percentage of total purchases for this term
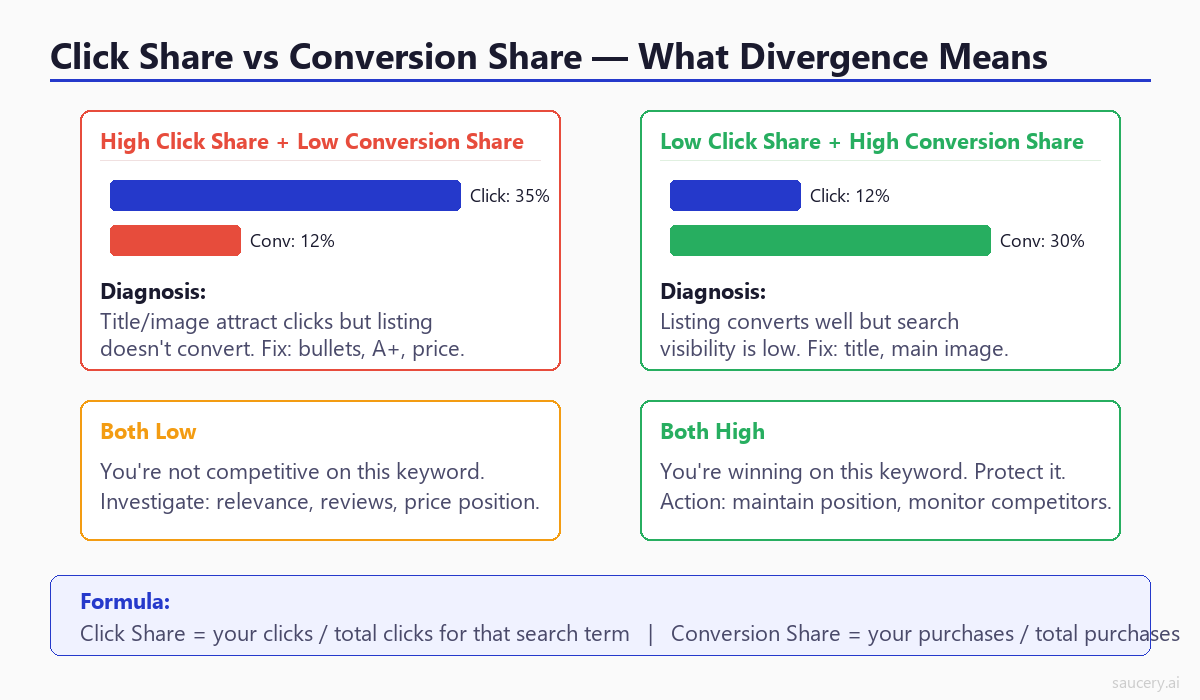
The most important comparisons are between your click share and your conversion share. If your click share is high but conversion share is low, shoppers are clicking to your listing but not buying – which means your listing content, price, or reviews are the problem. If click share is low but conversion share is high when they do click, your listing converts well but your title or main image is not compelling enough to earn the initial click. Both scenarios demand different optimisation approaches.
How to Use SQP Data Effectively
Export the data to a spreadsheet and sort by search query volume (descending). This gives you your highest-value keywords first. For each one, calculate the ratio between your click share and conversion share. A healthy ratio is close to 1:1. Large divergences in either direction represent optimisation opportunities that are costing you sales every day they remain unfixed.
Cross-reference these findings with your product title optimisation strategy. The keywords driving the most impressions should appear prominently in your title – if they do not, you are leaving money on the table.
Top Search Terms Report: What It Tells You and What It Does Not
The Top Search Terms report ranks the most popular search terms on Amazon by search frequency. For each term, it shows the top three clicked ASINs along with their click share and conversion share. This is category-wide data, not brand-specific.
What You Can Learn
- Relative search popularity – Which terms shoppers use most frequently in your category
- Competitive landscape – Which ASINs dominate each search term
- Seasonal trends – How search terms rise and fall across reporting periods
- New keyword discovery – Terms you may not have considered that are driving significant volume
- Market share indicators – Whether you appear in the top 3 for your most important keywords
What It Does Not Tell You
- Absolute search volume – You get a search frequency rank (1, 2, 3, etc.) but not the actual number of searches. A rank of 1 might mean 500,000 searches or 5,000 – you cannot tell from this report alone.
- Your own performance – Unless you are in the top 3 clicked ASINs, your product does not appear. Use the SQP report for your own brand’s data.
- Long-tail opportunities – The report focuses on high-volume terms. Lower-volume, high-intent keywords that might convert better for your product are not visible here.
- Search intent – Two keywords might have similar volume but very different intent. “Protein bars” is browsing; “Quest chocolate chip cookie dough protein bar 12 pack” is buying.
Use the Top Search Terms report for strategic direction – understanding what the market is searching for. Use the SQP report for tactical execution – understanding how your products perform against those searches. The two reports work together but answer fundamentally different questions.
Search Funnel Metrics: Impressions, Clicks, Cart Adds, Purchases
Brand Analytics breaks the customer journey into four measurable stages. Each stage represents a decision point where shoppers either continue toward purchase or drop out. Understanding where your products lose shoppers tells you exactly what to fix.
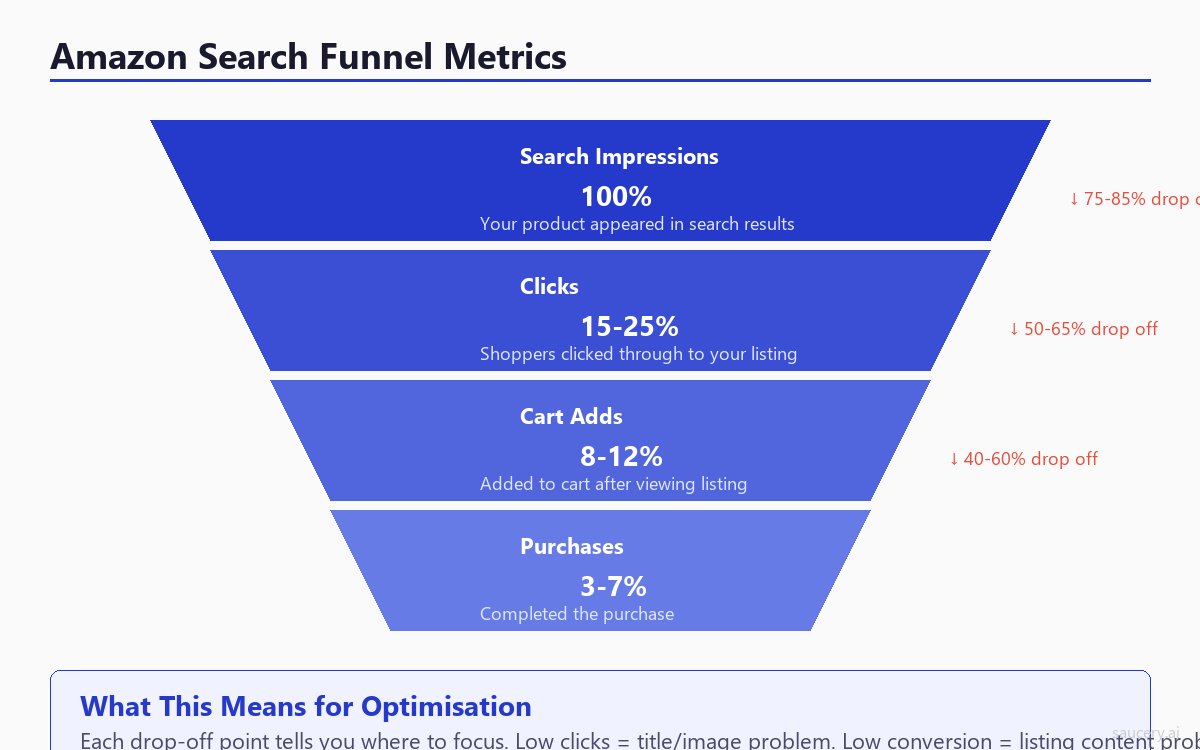
Stage 1: Search Impressions
An impression means your product appeared in search results for a given term. If you are getting zero impressions for a keyword, Amazon’s algorithm does not consider your listing relevant for that term – which means the keyword is either missing from your listing entirely or buried so deep in your content that the algorithm does not weight it highly enough.
Low impressions relative to total search volume means your Amazon SEO needs work. Check that the keyword appears in your title, bullet points, backend search terms, or A+ content. Impressions are the top of the funnel – if you are not appearing, nothing else matters.
Stage 2: Clicks
A click means a shopper saw your product in search results and decided to learn more. The click decision is driven almost entirely by four factors visible on the search results page: your main image, title, price, and star rating/review count. If your impression-to-click rate is low, one or more of these four elements is not competitive.
Compare your click share to your impression share. If you are getting 10% of impressions but only 3% of clicks, your search result listing is underperforming. If you are getting 10% of impressions and 15% of clicks, your main image and title are working harder than average – a good sign.
Stage 3: Cart Adds
A cart add means the shopper visited your listing, read your content, and was convinced enough to add to cart. The gap between clicks and cart adds is where your listing content does its work. Amazon bullet points, A+ content, secondary images, and product details all contribute to this conversion.
A large drop-off between clicks and cart adds means shoppers are visiting your listing and leaving unconvinced. Common causes: unclear benefits, missing information, poor secondary images, concerning reviews that go unaddressed, or a price that does not match the perceived value proposition.
Stage 4: Purchases
The final conversion. The gap between cart adds and purchases is typically smaller and harder to influence directly – it is affected by factors like shipping speed, stock availability, and comparison shopping across multiple carts. However, a large cart-to-purchase gap can indicate pricing issues (shoppers adding multiple options to compare later) or availability concerns.
When you read the funnel data for your brand, focus your optimisation effort on the stage with the largest drop-off relative to category benchmarks. Fixing the biggest leak delivers the most revenue impact per hour of effort.
Click Share and Conversion Share: What They Mean
Click share and conversion share are the two most actionable metrics in Brand Analytics. They tell you not just how you are performing in absolute terms, but how you are performing relative to every other product competing for the same search term.
Click Share Defined
Click share is the percentage of total clicks on a search term that went to your product. If 1,000 shoppers clicked on products after searching “organic protein powder” and 150 of those clicks went to your listing, your click share is 15%.
Click share is influenced by your search result presence: main image quality, title relevance, price competitiveness, star rating, review count, and badges (Best Seller, Amazon’s Choice, etc.). It measures how well you win attention on the search results page.
Conversion Share Defined
Conversion share is the percentage of total purchases from a search term that went to your product. If 100 people purchased a product after searching “organic protein powder” and 20 of those purchases were yours, your conversion share is 20%.
Conversion share is influenced by everything on your listing page: bullet points, A+ content, secondary images, reviews, Q&A, price, and availability. It measures how well you close the sale once shoppers arrive.
Interpreting the Divergence
The relationship between click share and conversion share tells a diagnostic story:
Click share higher than conversion share – You attract attention but do not close. Shoppers click through, look at your listing, and leave. Your search presence (title, main image) is working, but your listing content, price, or reviews are not converting. Priority: improve bullet points, A+ content, pricing strategy, and review management.
Conversion share higher than click share – You close well but do not attract enough clicks. When shoppers do reach your listing, they buy – but not enough are clicking through from search results. Priority: improve main image, title optimisation, and search result competitiveness.
Both high – You are winning on this keyword. Protect your position by monitoring weekly for competitors encroaching on your share.
Both low – You are not competitive on this keyword. Evaluate whether the keyword is actually relevant to your product, whether your price point is competitive, and whether you have enough reviews to compete. Sometimes the right answer is to deprioritise a keyword where you cannot win and focus on terms where you can.
How to Find Keyword Opportunities from Brand Analytics Data
Brand Analytics does not just confirm what you already know about your keywords. It reveals opportunities you would never find from keyword research tools alone – because it shows you actual shopper behaviour, not modelled estimates.
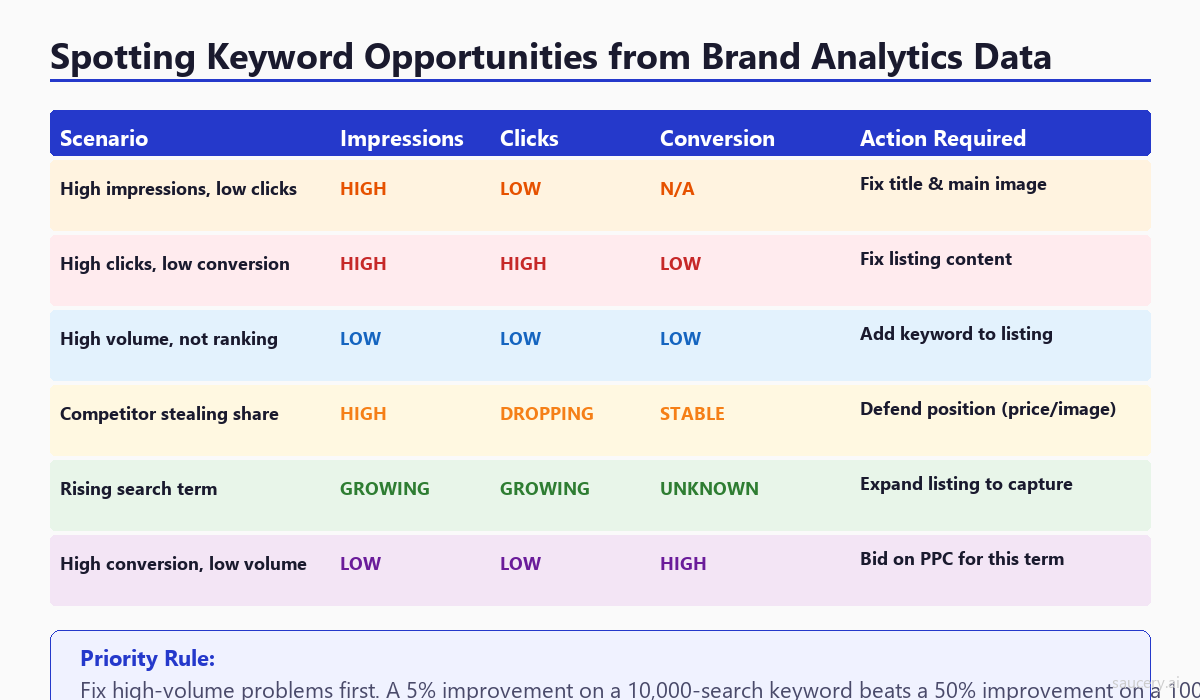
Opportunity Type 1: High Impressions, Low Clicks
You are ranking for this keyword (Amazon shows your product) but shoppers are not clicking through. This is a title and main image problem. Your product appears in search results but does not stand out enough to earn the click.
Fix: Ensure your title leads with the keyword and clearly communicates your key differentiator. Test a new main image that creates more visual contrast against competitors. Check that your price is not significantly higher than the surrounding results.
Opportunity Type 2: High Clicks, Low Conversion
Shoppers are interested enough to click but leave without buying. This is a listing content problem. Something on your product detail page is not convincing them – or is actively deterring them.
Fix: Review your bullet points for clarity and benefit-focused language. Check your secondary images tell a complete story. Look at your reviews for recurring objections you could address in your listing. Evaluate whether your pricing strategy positions you correctly for this keyword’s competitive set.
Opportunity Type 3: Competitor Keywords Where You Are Missing
Cross-reference the Top Search Terms report with your SQP data. If a high-volume keyword in your category does not appear in your SQP report at all, you are not ranking for it. Check whether the keyword is relevant to your product. If it is, add it to your listing – title, bullets, or backend search terms – and track whether impressions appear in the next reporting period.
Opportunity Type 4: Rising Search Terms
Compare Top Search Terms reports across multiple weeks. Keywords that are climbing the rankings represent growing demand. If you can optimise for these terms before your competitors notice the trend, you can capture disproportionate share while competition is still low.
Opportunity Type 5: High Conversion, Low Volume Keywords
Some keywords in your SQP report will show very high conversion share but low total search volume. These are high-intent, specific keywords where shoppers are ready to buy. While each individual term is small, the aggregate of 20-30 such terms can drive significant revenue. Ensure your listing captures these long-tail terms in backend search terms at minimum.
Using Search Query Data to Optimise Your Title
Your product title does two jobs simultaneously: it tells Amazon’s algorithm what your product is (for ranking) and it tells shoppers why they should click (for conversion). Brand Analytics data helps you make better decisions about both.
Step 1: Identify Your Highest-Value Keywords
Export your SQP data and sort by total search query volume. Your top 5-10 keywords by volume are the candidates for title inclusion. But volume alone is not enough – you also want keywords where you currently have low click share (meaning there is room to improve) or where you have high conversion share (meaning your product genuinely fits what shoppers are looking for).
Step 2: Determine Keyword Placement Priority
Amazon weights the first few words of your title most heavily for search ranking. Place your highest-volume, most relevant keyword at the very beginning of your title. Supporting keywords go in the middle and end. Title optimisation is not about cramming in as many keywords as possible – it is about structuring them so that both the algorithm and human shoppers can quickly understand your product.
Step 3: Compare Click-Driving vs Purchase-Driving Keywords
Some keywords drive a lot of clicks to your listing but few purchases. Other keywords drive fewer clicks but the shoppers who do come through buy at high rates. This distinction matters for title strategy.
Click-driving keywords are typically broader and more descriptive (“organic protein powder” or “wireless earbuds”). Purchase-driving keywords tend to be more specific and intent-rich (“vanilla plant protein powder 2lb” or “noise cancelling earbuds for running”). Your title should lead with the broadest high-volume keyword (for maximum impressions) and include specific purchase-intent modifiers (for conversion).
Step 4: Test Changes with A/B Testing
After you have identified the optimal keyword structure from Brand Analytics data, implement the change and use Amazon A/B testing (Manage Your Experiments) to validate that the new title actually performs better. Brand Analytics tells you what to test; A/B testing tells you whether the change worked.
Track your click share and conversion share for the target keywords across subsequent reporting periods. If both metrics improve after the title change, your optimisation worked. If click share improves but conversion share drops, you may have attracted less qualified traffic – refine further.
Market Basket Analysis: Cross-Sell Opportunities
The Market Basket Analysis report shows which products customers frequently buy in the same order as your product. This data reveals cross-selling opportunities, bundling ideas, and competitive intelligence you cannot get anywhere else.
What the Report Shows
For each of your ASINs, Market Basket Analysis lists the products most frequently purchased alongside it. You see the product title, ASIN, and the percentage of orders containing your product that also contained the paired product. A combination percentage of 5% means that 5 out of every 100 orders containing your product also included that other item.
Strategic Uses
Bundle creation: If two products are frequently bought together, consider creating a bundle listing. Bundles reduce friction for the shopper and often command a slight premium over buying items separately.
Advertising targeting: Run Sponsored Product ads targeting the ASINs that appear in your Market Basket. If shoppers already buy these products with yours, advertising on those listing pages puts your product in front of a pre-qualified audience.
Product line expansion: Recurring patterns reveal what your customers need that you do not currently offer. If a specific complementary product appears across multiple ASINs in your catalogue, it might be worth developing or sourcing that product yourself.
Competitive intelligence: If a competitor’s product appears frequently in your market basket, shoppers may be splitting their purchases between you and a competitor. Understand why – is it variety seeking, or is the competitor stronger in certain variants you do not offer?
Market Basket Analysis is particularly valuable for brands with multiple SKUs. Understanding which of your own products are bought together helps optimise your product launch strategy and portfolio architecture.
Repeat Purchase Behaviour: Retention Insights
The Repeat Purchase Behaviour report shows what percentage of your customers buy again, and how many times. For consumable products – food, supplements, beauty, household supplies – this is one of the most important metrics available.
Key Metrics
- Ordered product sales (total) – Revenue from all orders in the period
- Repeat customer ordered product sales – Revenue from customers who purchased before
- Repeat customer percentage – What share of revenue comes from returning buyers
- Order frequency distribution – Breakdown of how many orders each customer has placed
What Repeat Purchase Data Tells You
Product-market fit: High repeat rates (above 30% for consumables) indicate strong product-market fit. Shoppers tried your product and came back. Low repeat rates suggest either a product quality issue or that your initial purchase was driven by heavy discounting that did not reflect sustainable value.
Subscribe & Save viability: Products with high repeat purchase rates are strong candidates for Subscribe & Save enrollment. If customers are manually reordering, make it easy for them to automate. This locks in recurring revenue and makes your business more defensible.
Review prediction: High repeat purchase rates typically correlate with positive review trajectories. If customers buy repeatedly, they are satisfied – and satisfied customers are more likely to leave positive reviews when prompted. This creates a virtuous cycle between purchases and social proof.
Listing optimisation implications: If your repeat rate is low, investigate whether your listing over-promises. Misalignment between what shoppers read on your listing and what they actually experience drives low repeat rates and negative reviews. Honest, specific claims convert less aggressively on first purchase but build a more sustainable business.
Demographics Data: Who Is Buying Your Products
The Demographics report breaks down your customer base by age group, household income, education level, gender, and marital status. While this data is aggregated and cannot identify individual customers, it reveals patterns that should inform your listing content and advertising strategy.
Available Demographic Dimensions
- Age – 18-24, 25-34, 35-44, 45-54, 55-64, 65+
- Household income – Ranges from under $50K to $150K+
- Education – High school, some college, bachelor’s, graduate/professional
- Gender – Male, female
- Marital status – Single, married/domestic partnership
How to Apply Demographic Insights
Listing language: If your product over-indexes with a specific age group or education level, align your listing language to that audience. A product bought primarily by 25-34 year olds with graduate education can use more technical language than one bought by a broader demographic.
Image strategy: Your lifestyle images should reflect your actual buyer demographics. If Brand Analytics shows your customer base is primarily women aged 35-44, your lifestyle images should feature that demographic – not a generic stock photo of a 22-year-old.
Advertising audiences: Use demographic data to refine your Amazon DSP targeting and Sponsored Display audiences. Align your advertising spend with the demographics that actually buy, rather than the demographics you assumed would buy.
Product positioning: If your demographics surprise you – for example, you expected a premium product to attract high-income buyers but it is actually popular with middle-income households – that insight should reshape your product differentiation and messaging strategy. Let the data guide your positioning, not your assumptions.
Limitations of Brand Analytics
Brand Analytics is powerful but it has real constraints you need to understand to avoid making bad decisions from incomplete data.
Data Lag
Reports appear 3-7 days after the end of a reporting period. If you make a listing change on Monday and want to see its impact in weekly data, you will not see results until 10-14 days later at the earliest. This means rapid iteration based on Brand Analytics alone is not possible – you need faster feedback loops (like A/B testing and advertising metrics) for quick-turn optimisation.
Aggregation and Thresholds
Amazon aggregates data to protect customer privacy. Low-volume search terms may not appear at all because they fall below the reporting threshold. If you sell a niche product, some of your most important long-tail keywords may never show up in Brand Analytics. The reports are biased toward higher-volume terms.
No Historical Data Export
Brand Analytics does not let you access historical data beyond the current and previous few periods. If you want to track trends over months or years, you must export the data manually every week and build your own historical database. Miss a week and that data is gone forever.
Relative Not Absolute Metrics
Many metrics are expressed as shares or ranks rather than absolute numbers. You know your click share is 12% but not whether that represents 120 clicks or 1,200. For absolute numbers, you need to cross-reference with your advertising reports or Search Query Performance data (which does show actual counts for your brand).
Brand Registry Requirement
You need an active registered trademark to access Brand Analytics. New sellers without trademarks – or sellers in categories where branding is less common – cannot access this data. The trademark process itself takes 6-12 months in most countries, creating a significant barrier for new brands.
No Real-Time Data
Unlike advertising reports (which update within hours), Brand Analytics data is only available in defined reporting periods. You cannot check how today’s search terms are performing – you are always looking at data from the past. For real-time decisions, use your advertising Search Term report and Business Reports as complementary data sources.
Combining Brand Analytics with Third-Party Tools
Brand Analytics gives you real data but limited views. Third-party tools give you broader views but estimated data. The combination is more powerful than either alone.
Helium 10
Helium 10’s Cerebro provides estimated search volumes for any keyword – not just those where you rank. Use Brand Analytics to validate Helium 10’s estimates for your known keywords, then use Helium 10 to research keywords that do not appear in your Brand Analytics data. When estimates diverge significantly from Brand Analytics actuals, trust Brand Analytics – it is real data.
Helium 10’s Magnet tool helps expand your keyword list beyond what Brand Analytics surfaces. Use it to find related terms, synonyms, and long-tail variations that may fall below Brand Analytics’ reporting threshold but still drive meaningful traffic.
Jungle Scout
Jungle Scout’s Keyword Scout provides competitor keyword data – showing which keywords any ASIN ranks for. Cross-reference this with Brand Analytics Top Search Terms to understand which high-volume keywords your competitors are capturing that you are missing. Jungle Scout also provides historical search volume trends that fill Brand Analytics’ historical data gap.
DataDive and Other Analytics Platforms
Tools like DataDive specialise in processing and visualising Brand Analytics data over time. They automate the weekly export process, build historical trend charts, and alert you to significant changes in your click share or conversion share. If you manage multiple ASINs, automation tools turn Brand Analytics from a manual weekly task into a passive monitoring system.
Amazon Advertising Console
Your own advertising Search Term report provides real-time keyword data for terms where you are running ads. Use it alongside Brand Analytics to get both immediate performance feedback (advertising data) and broader competitive context (Brand Analytics). Advertising data tells you how specific keywords perform when you pay for placement; Brand Analytics tells you how they perform in organic search.
The key principle: use Brand Analytics as your source of truth for what matters, and third-party tools to fill in the gaps where Brand Analytics has blind spots. Never trust an estimate over actual data when both are available.
Practical Workflow: Weekly Brand Analytics Review Process
Consistency beats intensity. A 30-minute weekly review of Brand Analytics delivers more value over time than a 4-hour deep dive once a quarter. Here is the workflow I use.
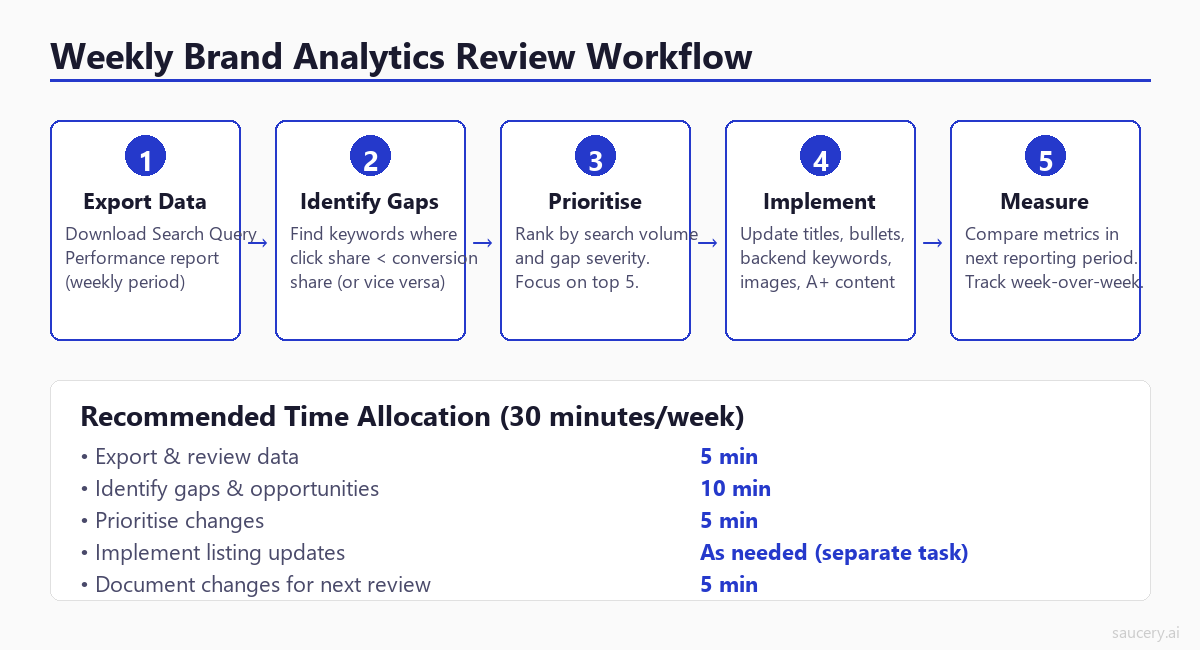
Monday: Export and Compare
Every Monday, export your Search Query Performance data for the most recent available week. Save it in a consistent format (I use a Google Sheet with one tab per week). Compare this week’s data to last week’s and look for three things:
- New keywords appearing – Terms that show up in your SQP report for the first time. These might be seasonal, trending, or the result of a recent listing change.
- Significant share changes – Any keyword where your click share or conversion share moved more than 3 percentage points in either direction. Investigate why.
- Disappearing keywords – Terms that were in last week’s report but have vanished. This might indicate a loss of ranking, a seasonal decline, or a competitor capturing the position.
Tuesday-Wednesday: Investigate and Prioritise
For each significant change identified on Monday, investigate the cause. Check whether you or a competitor made listing changes, whether there was a price shift, or whether the change correlates with an advertising campaign adjustment.
Prioritise your action items by multiplying the search volume of the keyword by the size of the opportunity. A 5% click share improvement on a keyword with 50,000 weekly searches is worth more than a 20% improvement on a keyword with 500 searches. Focus on the top 3-5 opportunities.
Thursday-Friday: Implement Changes
Make one listing change at a time and document exactly what you changed and why. This is critical for the measurement phase – if you change five things simultaneously, you cannot isolate what worked. Common changes based on Brand Analytics insights:
- Reordering keywords in your title based on search volume priority
- Adding missing high-value keywords to backend search terms
- Updating bullet points to address the conversion gap for specific keywords
- Refreshing main image to improve click-through for terms where you have high impressions but low clicks
- Adjusting price position for keywords where competitors are winning on value
Ongoing: Track and Compound
Two weeks after any listing change, check the Brand Analytics data for that specific keyword. Did your click share improve? Did your conversion share change? Document the outcome and use it to inform your next round of optimisations. Over time, this creates a compounding effect – each improvement builds on the last, and your understanding of what works for your specific product deepens with every iteration.
This workflow takes 30 minutes on Monday and influences your listing priorities for the rest of the week. It is not glamorous. But sellers who do it consistently outperform those who optimise sporadically based on gut feeling.
Turning Data into Listing Changes: The Action Bridge
The biggest mistake sellers make with Brand Analytics is treating it as a dashboard to look at rather than a decision-making tool to act on. Every data point should map to a specific listing element you can change. Here is the action bridge.
Data Signal to Listing Action Map
Low impression share for a relevant keyword – Add keyword to title, bullets, or backend search terms. Verify the keyword exists somewhere in your listing that Amazon indexes.
High impressions, low click share – Optimise main image, title structure, or price display. These are the only elements visible on the search results page. Something about your search result is not compelling enough versus competitors.
High click share, low conversion share – Improve listing detail page content. This includes bullet points, secondary images, A+ content, and the overall value proposition communicated on the page. Shoppers are arriving and leaving unconvinced.
Declining click share week-over-week – A competitor is taking share. Check if a new competitor has entered with better images, lower prices, or badges (Best Seller, Amazon’s Choice). Respond with competitive improvements to your search result presence.
Rising keyword in Top Search Terms – Expand your listing to capture this growing demand before competitors. Add the keyword to your backend terms immediately and consider working it into your title if volume continues to grow.
Market Basket showing competitor pairing – Consider why shoppers buy both. If it is because you and the competitor serve slightly different use cases, consider expanding your product range. If it is comparison shopping, ensure your listing clearly communicates why your product is the better choice.
The One Change at a Time Rule
Resist the temptation to implement five optimisations simultaneously. Each Brand Analytics reporting period should test one hypothesis: “If I change X, will metric Y improve?” When you change multiple variables, you cannot attribute improvements to specific actions – which means you cannot learn from the data and your optimisation process does not compound.
The exception is backend search terms, which are invisible to shoppers. You can add missing keywords to backend terms at any time without affecting other metrics – it is purely additive for search visibility and carries no conversion risk.
For visible listing elements (title, images, bullets, A+ content), change one at a time and give it at least two reporting periods before evaluating. Some changes take time to fully impact the algorithm – patience is part of the methodology.
This disciplined approach to listing optimisation – grounded in e-commerce listing best practices and validated by Brand Analytics data – separates sellers who improve consistently from those who thrash between changes without understanding what works.
Frequently Asked Questions
Is Amazon Brand Analytics free?
Yes. Brand Analytics is completely free for sellers enrolled in Amazon Brand Registry with a Professional Seller account ($39.99/month). There is no additional subscription or fee to access any of the reports – Search Query Performance, Top Search Terms, Market Basket Analysis, Repeat Purchase Behaviour, and Demographics are all included.
How often is Brand Analytics data updated?
Data is available in weekly, bi-weekly, monthly, and quarterly reporting periods. Weekly data typically becomes available 3-7 days after the end of the reporting week. For example, data for a Sunday-to-Saturday week usually appears by the following Wednesday or Thursday. There is no daily or real-time data available.
Can I see exact search volumes in Brand Analytics?
It depends on the report. The Search Query Performance report shows actual search query volume numbers for terms your brand ranks on. The Top Search Terms report only shows a search frequency rank (relative position) rather than absolute volume. For complete search volume data across all keywords, you will need to supplement with third-party tools like Helium 10 or Jungle Scout.
What is the difference between click share and conversion share?
Click share is the percentage of all clicks on a search term that go to your product. Conversion share is the percentage of all purchases from that search term that are your product. Click share measures how well your search result attracts attention. Conversion share measures how well your listing closes sales. When these two metrics diverge significantly, it tells you exactly where in the funnel your listing needs improvement.
How do I use Brand Analytics to improve my Amazon SEO?
Export your Search Query Performance data and identify high-volume keywords where you have low impression share or low click share. Low impression share means the keyword may be missing from your listing – add it to your title, bullets, or backend terms. Low click share means you are ranking but not earning clicks – improve your title and main image for that keyword. Track changes week-over-week to validate improvements. For a complete Amazon SEO strategy, Brand Analytics data should drive your keyword prioritisation decisions.
Does Brand Analytics show competitor data?
Partially. The Top Search Terms report shows the top 3 clicked ASINs for each search term, along with their click share and conversion share. This lets you see which competitors dominate specific keywords. However, you cannot see detailed funnel data for competitors the way you can for your own brand in the SQP report. Market Basket Analysis also provides indirect competitive intelligence by showing which competitors’ products are bought alongside yours.
How long does it take to see results from listing changes informed by Brand Analytics?
Due to the data lag in Brand Analytics reporting, expect to wait 2-3 weeks after implementing a change before you can measure its impact. Backend search term additions may show impression gains within one reporting period. Title changes typically impact click share within 1-2 periods. Major listing overhauls (images, A+ content, bullets) may take 3-4 periods to fully reflect in the data as Amazon’s algorithm adjusts relevance scores.
Can I access Brand Analytics for international marketplaces?
Brand Analytics is available on Amazon’s major marketplaces including the US, UK, Germany, France, Italy, Spain, Canada, Japan, and Australia. However, Brand Registry must be active in each specific marketplace – enrollment in one country does not automatically grant access to Brand Analytics in another. Each marketplace provides its own localised data reflecting that market’s search and purchase behaviour.
Same product. Better listing. More sales.
Brand Analytics shows you where shoppers drop off. The next step is turning those insights into listing changes that close the gap between clicks and purchases.
About the Author
Andrew Mac is the founder of Saucery, where he helps brands optimise product listings using AI-modelled shopper behaviour. He has spent the last decade working with consumer brands on product positioning, pricing, and e-commerce strategy across Amazon, Shopify, and retail channels.
Subscribe for F&B Consumer Insights
Data-driven insights on food & beverage consumer preferences, straight to your inbox.