Your Amazon conversion rate is the single most important metric you are probably not optimising. It determines how efficiently you turn browsers into buyers, directly impacts your organic ranking, and compounds over time to either build or erode your market position.
Most sellers obsess over traffic – running PPC campaigns, chasing keywords, bidding on competitors. But a listing converting at 8% needs twice the traffic to match a competitor converting at 16%. Fix your conversion rate first, and every traffic dollar works harder.
This guide covers exactly what Amazon conversion rate means, where yours stands relative to category benchmarks, what is killing it, and which fixes deliver the biggest lift. Every recommendation is backed by data from seller experiments and Amazon’s own reporting.
Table of Contents
- What Is Amazon Conversion Rate?
- Average Amazon Conversion Rate: The Real Numbers
- Why Amazon Converts So Much Higher Than Shopify and DTC
- Conversion Rate Benchmarks by Category
- How to Find Your Conversion Rate in Seller Central
- The Relationship Between Conversion Rate and Organic Ranking
- What Kills Your Conversion Rate
- Listing Elements Ranked by Conversion Impact
- Main Image Optimisation for Conversion
- Title Optimisation for Conversion
- Bullet Point Structure for Conversion
- Price Perception: How to Frame Price Without Being Cheapest
- Review Velocity and Its Effect on Conversion
- A+ Content: Measurable Conversion Lift
- Mobile Conversion: Why It Is Lower and How to Fix It
- Seasonal Conversion Patterns
- Frequently Asked Questions
What Is Amazon Conversion Rate?
Amazon conversion rate measures the percentage of visitors to your product listing who complete a purchase. Amazon calls this metric “Unit Session Percentage” in Seller Central, and it is calculated as:
Unit Session Percentage = (Units Ordered / Sessions) x 100
This is different from “Order Session Percentage,” which measures orders rather than units. If a customer orders 3 units of your product in a single session, your Unit Session Percentage counts all 3 units, while Order Session Percentage counts it as 1 order. For most sellers, Unit Session Percentage is the more useful metric because it reflects actual revenue generation.
A “session” on Amazon is a single visit from a unique visitor within a 24-hour period. If the same shopper visits your listing in the morning and again in the evening, that counts as one session. This is important context – Amazon is already deduplicating repeat visits, so your conversion rate reflects genuine purchase decisions against unique visitors.
Understanding this distinction matters because some sellers confuse page views with sessions. Page views include every single time your listing loads (including refreshes and the same person viewing multiple times). Sessions are unique visitors. Your conversion rate should always be calculated against sessions, not page views.
Average Amazon Conversion Rate: The Real Numbers
The average Amazon conversion rate sits between 10% and 15% across all categories. This is dramatically higher than any other e-commerce channel – standalone e-commerce sites typically convert at 2-3%, and even well-optimised Shopify stores rarely exceed 4%.
According to Jungle Scout’s aggregate data, the platform-wide average hovers around 12.5%. But this average masks enormous variation. Top-performing listings in high-intent categories regularly achieve 20-30% conversion rates, while poorly optimised listings in competitive categories can drop below 5%.
For Prime members specifically, conversion rates are even higher. Marketplace Pulse research suggests Prime member conversion rates run 2-3 percentage points above non-Prime visitors, which makes sense given their pre-existing commitment to the platform and expectation of fast, free shipping.
Here is what the distribution actually looks like across Amazon sellers:
- Bottom 25% of sellers: Below 7% conversion rate
- Median seller: 10-12% conversion rate
- Top 25% of sellers: 15-20% conversion rate
- Top 10% (category leaders): 20%+ conversion rate
If your conversion rate is below 10%, you are leaving significant revenue on the table. If it is below 7%, there are likely fundamental listing problems that need addressing immediately.
Same product. Better listing. More sales.
Why Amazon Converts So Much Higher Than Shopify and DTC
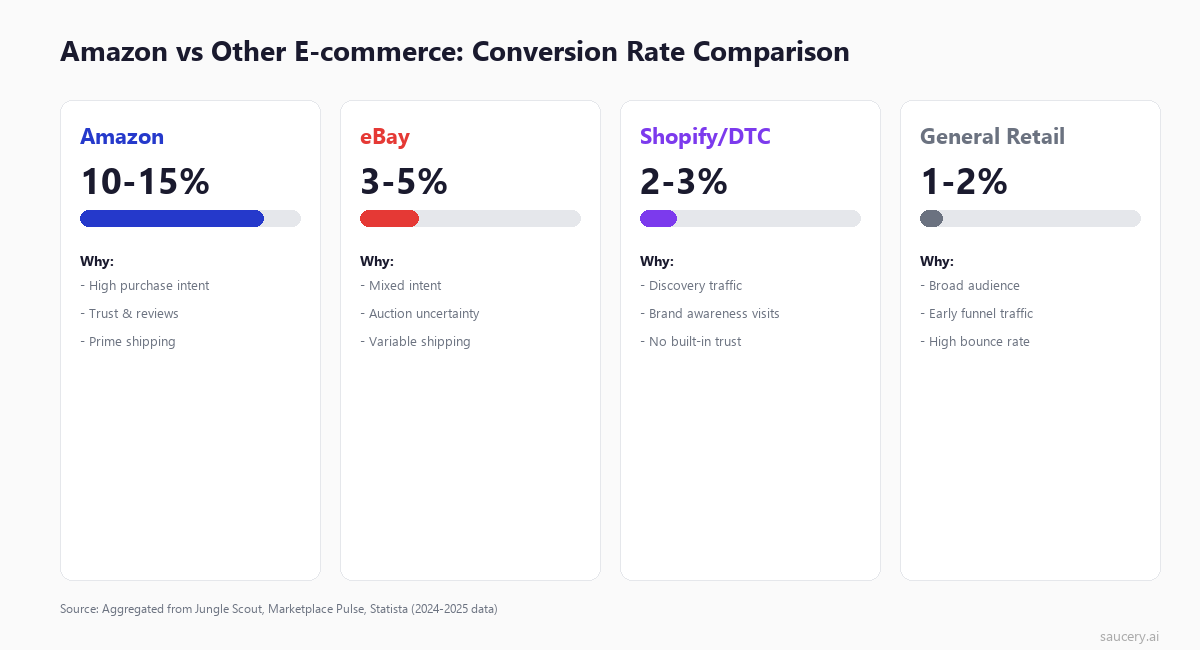
The 4-5x conversion rate gap between Amazon and standalone e-commerce is not an accident. It reflects fundamental differences in buyer psychology and platform infrastructure that every seller should understand.
Purchase intent is pre-qualified. When someone searches on Amazon, they are typically ready to buy. Google searches mix research, comparison, and purchase intent. Social media traffic is often curiosity-driven. But an Amazon search for “wireless noise cancelling headphones under $100” signals a buyer who has already decided what they want and is choosing between options. This pre-qualified intent is the single biggest reason Amazon converts higher.
Trust is built into the platform. Shoppers on your DTC site need to evaluate whether you are legitimate, whether their payment is secure, whether the product will arrive. On Amazon, that trust is assumed. Amazon handles payments, guarantees delivery, and offers easy returns. The shopper’s only decision is “is this the right product?” not “is this a trustworthy transaction?”
Prime removes friction. For Prime members, shipping cost and speed are non-issues. There is no cart-abandonment moment where they see a $12.99 shipping fee and leave. The path from “I want this” to “I bought this” has fewer barriers on Amazon than anywhere else in e-commerce.
Reviews provide social proof at scale. A DTC site might have 20 reviews. The same product on Amazon might have 2,000. This density of social proof – with verified purchase badges, photos, and detailed breakdowns – gives buyers confidence they cannot get elsewhere. Amazon’s review ecosystem is a conversion engine that independent sites cannot replicate.
Comparison shopping is contained. On Amazon, the alternatives are visible and structured. The shopper compares your listing to similar products on the same platform with the same trust level. On a DTC site, the “alternative” is leaving your site entirely and searching elsewhere – which introduces friction and uncertainty that often kills the purchase.
Conversion Rate Benchmarks by Category
Your conversion rate is only meaningful when compared to your category average. A 10% conversion rate is excellent in Electronics but below average in Health and Personal Care. Here are the realistic ranges based on aggregated data from Jungle Scout, Marketplace Pulse, and seller community reports:
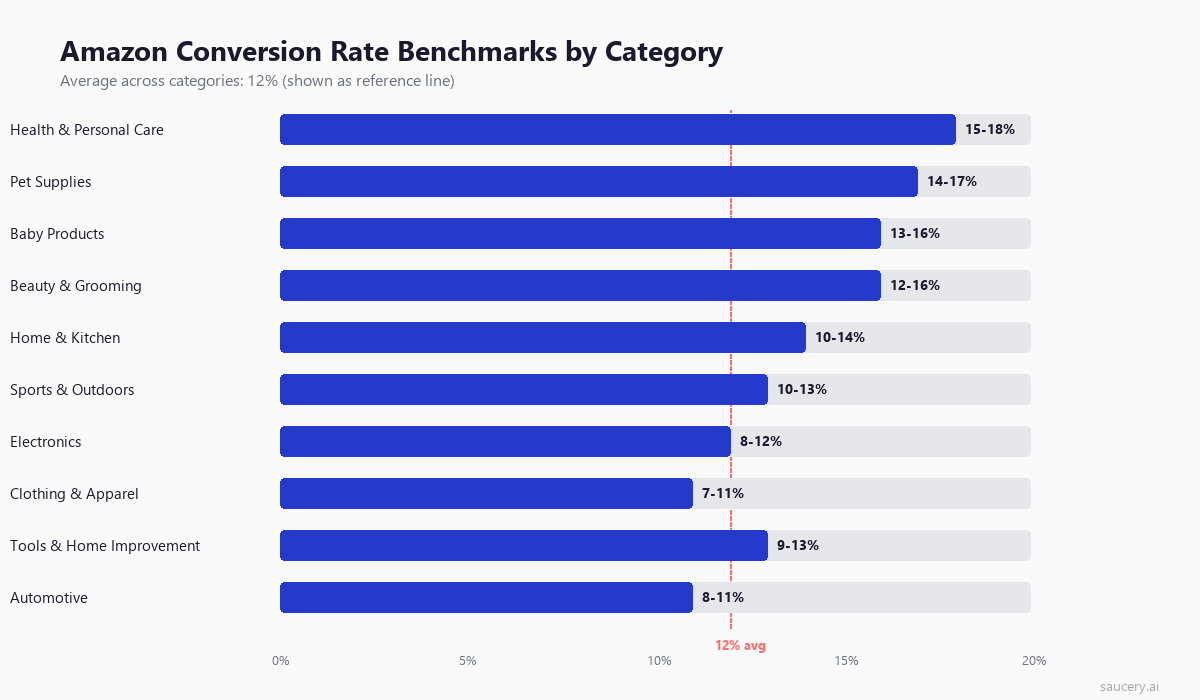
| Category | Typical Range | Why |
|---|---|---|
| Health & Personal Care | 15-18% | Replenishment buying, brand loyalty, Subscribe & Save |
| Pet Supplies | 14-17% | Repeat purchases, emotional buying, limited alternatives |
| Baby Products | 13-16% | Urgent need, safety-driven trust in reviews |
| Beauty & Grooming | 12-16% | Brand-driven, visual listings convert well |
| Home & Kitchen | 10-14% | Broad category, mix of impulse and considered purchases |
| Sports & Outdoors | 10-13% | Seasonal variation, size/fit concerns reduce conversion |
| Electronics | 8-12% | Higher price, more comparison shopping, spec-heavy decisions |
| Clothing & Apparel | 7-11% | Fit uncertainty, style subjectivity, high return expectation |
| Tools & Home Improvement | 9-13% | Specification matching required, DIY research phase |
| Automotive | 8-11% | Compatibility concerns, fitment verification needed |
The pattern is clear: categories with higher replenishment rates, emotional buying triggers, and lower price points convert better. Categories requiring specification matching, size decisions, or significant research convert lower. This is not a quality judgment – it reflects buyer behaviour patterns.
Use these benchmarks to set realistic targets. If you are selling electronics at 11% conversion, you are performing well. If you are selling health supplements at 11%, you are underperforming and leaving money on the table.
How to Find Your Conversion Rate in Seller Central
Finding your actual conversion rate data in Seller Central is straightforward once you know where to look. Here is the exact path:
- Log into Seller Central
- Navigate to Reports > Business Reports
- Select “Detail Page Sales and Traffic by Child Item” (under “By ASIN”)
- Look for the column “Unit Session Percentage” – this is your conversion rate
- Set date range to at least 30 days for meaningful data
Key columns to pay attention to in this report:
- Sessions: Unique visitors to your listing (not page views)
- Page Views: Total times your listing was loaded (includes repeat views)
- Unit Session Percentage: Your conversion rate (units ordered / sessions)
- Order Session Percentage: Orders / sessions (counts multi-unit orders as 1)
- Buy Box Percentage: How often you held the Buy Box (critical for conversion)
A few important notes on this data. First, the numbers update with a 48-72 hour delay, so do not make reactive decisions based on yesterday’s data. Second, if your Buy Box percentage is below 90%, your conversion rate is artificially depressed because shoppers who click your listing sometimes see another seller’s offer. Third, use the “By Child Item” report rather than the parent ASIN report – conversion rates vary significantly between size/colour variations of the same product.
For brands enrolled in Amazon Brand Analytics, you get additional data including search query performance, market basket analysis, and demographic insights that help explain why your conversion rate is where it is. This data is particularly valuable for understanding which search terms drive high-converting traffic versus browsing traffic.
Same product. Better listing. More sales.
The Relationship Between Conversion Rate and Organic Ranking
Amazon’s A10 algorithm uses conversion rate as one of its strongest ranking signals. The logic is simple from Amazon’s perspective: listings that convert well make Amazon money. Listings that do not convert waste valuable search result real estate. So Amazon systematically promotes high-converting listings and demotes low-converting ones.
This creates a flywheel effect that works in both directions. High conversion rate leads to better organic ranking, which leads to more traffic from high-intent keywords, which maintains or improves conversion rate. Conversely, low conversion leads to ranking drops, which shifts your remaining traffic to lower-intent keywords, which further depresses conversion. Understanding Amazon SEO means understanding that conversion rate is not just an efficiency metric – it is your primary ranking lever.
The practical implication: improving conversion rate by even 2-3 percentage points can trigger a ranking improvement that delivers more organic traffic, which compounds into significantly more sales without additional ad spend. This is why experienced sellers prioritise conversion rate optimisation over pure traffic acquisition.
According to analysis of Amazon’s algorithm behaviour, conversion rate is weighted alongside:
- Sales velocity: Total units sold in recent periods
- Relevance: How well your listing matches the search query (driven by keyword research and placement)
- Customer satisfaction: Return rates, negative feedback, A-to-Z claims
- Price competitiveness: Relative to similar products
But conversion rate is the metric you have the most direct control over through listing optimisation, and it feeds directly into sales velocity (more conversions = more sales). It is the highest-leverage factor in your Amazon SEO strategy.
What Kills Your Conversion Rate
Before optimising, you need to diagnose what is actually suppressing your conversion rate. These are the most common conversion killers ranked by estimated negative impact, based on aggregated split-test data and seller experiments:
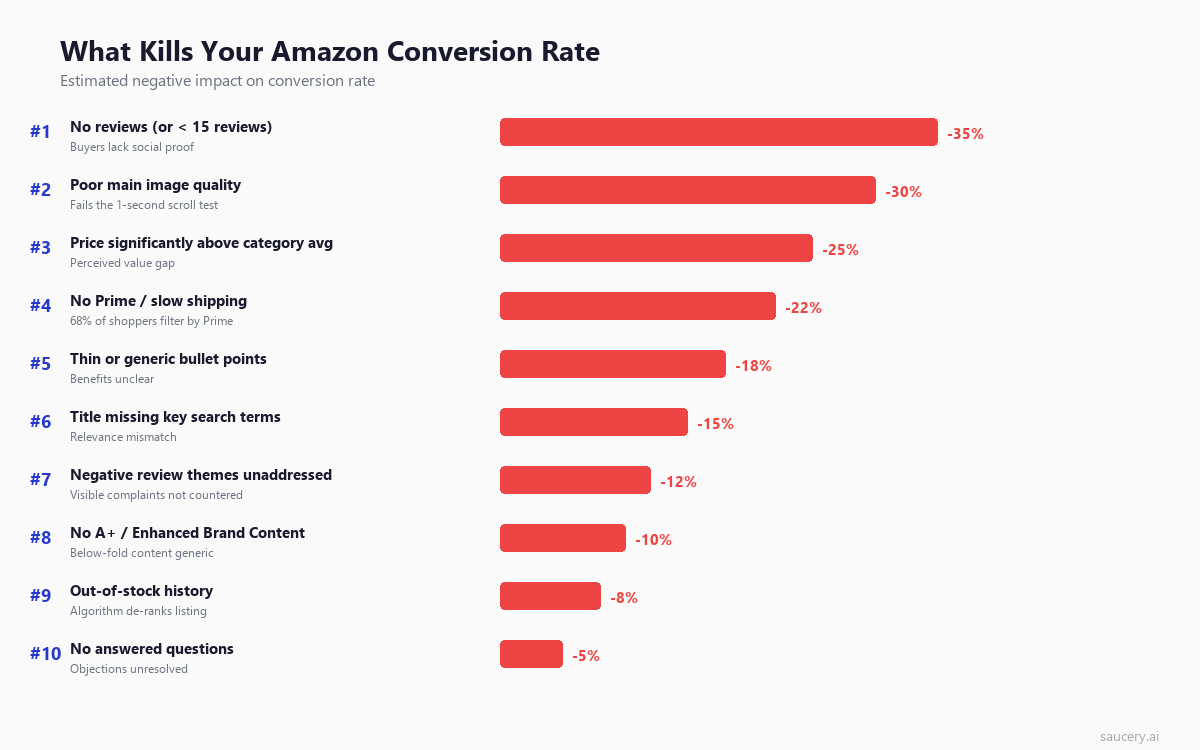
No reviews or fewer than 15 reviews (up to -35% impact). This is the single biggest conversion killer for new products. Statista research shows 93% of consumers read reviews before purchasing. Below 15 reviews, shoppers perceive significant risk. The jump from 0 to 15 reviews typically doubles or triples conversion rate.
Poor main image quality (up to -30% impact). Your main image is the first and often only thing shoppers evaluate before deciding to click or scroll past. A low-resolution, poorly lit, or confusing main image fails what I call the “one-second test” – can a shopper scrolling through search results understand what your product is and why it is worth clicking within one second?
Price significantly above category average (up to -25% impact). This is not about being expensive – premium products can convert well. It is about unjustified price premiums. If your product is 40% more expensive than visually similar alternatives and your listing does not clearly communicate why, shoppers will choose the cheaper option. Price perception is about framing, not just numbers.
No Prime or slow shipping (up to -22% impact). Amazon’s own data suggests that 68% of Amazon shoppers regularly filter results to show only Prime-eligible items. If you are not Prime-eligible (either through FBA or Seller Fulfilled Prime), you are invisible to more than two-thirds of the buying audience. For the third who do see you, the lack of Prime is a trust signal that reduces willingness to purchase.
Thin or generic bullet points (up to -18% impact). Bullet points that read like they were copied from a competitor’s listing or generated by basic AI tools without customisation fail to differentiate your product. Effective bullet points front-load specific benefits, use concrete numbers, and address the exact concerns your target buyer has. Generic bullets like “Premium quality material” or “Perfect gift for any occasion” convert poorly because they could describe any product.
Title missing key search terms (up to -15% impact). When a shopper searches for “stainless steel insulated water bottle 32oz” and your title says “Premium Hydration Vessel – Large Size – Keep Drinks Cold,” there is a relevance disconnect. The shopper wonders if they landed on the right product. Your title must confirm that this listing matches what they searched for, or they will bounce back to results.
Listing Elements Ranked by Conversion Impact
Not all listing elements contribute equally to conversion. Here is how they rank based on aggregated A/B test data and the observed impact when each element is optimised from below-average to best-in-class:
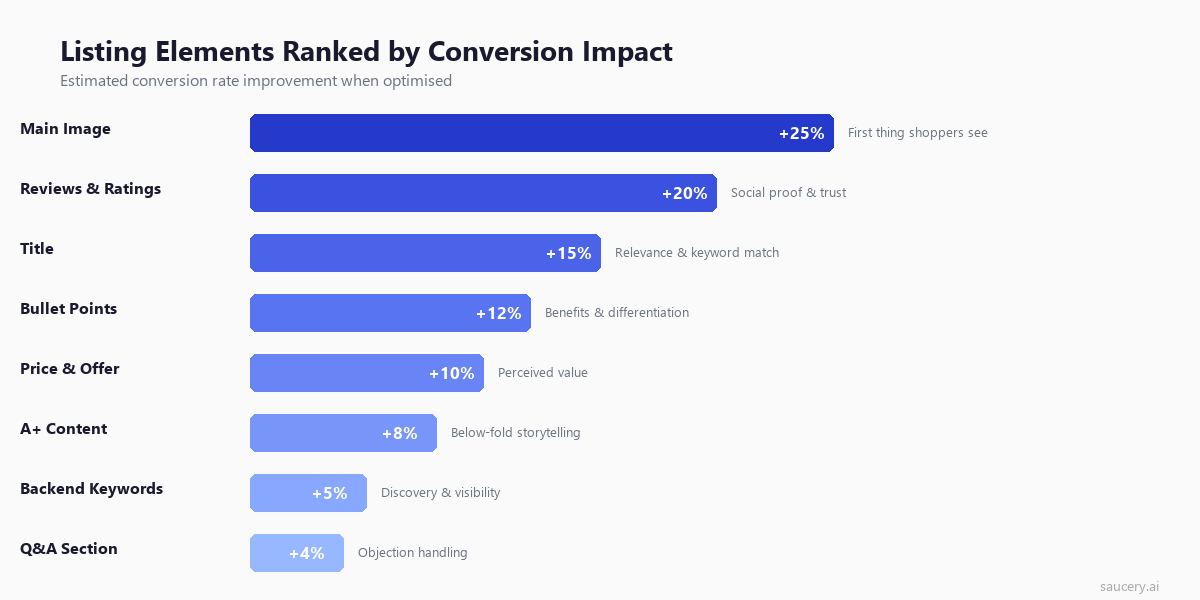
This ranking reflects a clear priority order for listing optimisation. If your conversion rate is below category average, start with your main image. If that is already strong, move to reviews and title. The diminishing returns mean that A+ content and backend keywords are only worth investing in once your foundational elements (image, reviews, title, bullets) are performing well.
An important nuance: these are average impacts across thousands of listings. Your specific product may vary. A highly visual product (home decor, fashion) will see even larger image impact. A technical product (electronics, tools) will see higher title and bullet point impact because buyers need specification confirmation. Use A/B testing to validate which elements matter most for your specific category.
Main Image Optimisation for Conversion (The 1-Second Test)
Your main image has a disproportionate impact on conversion because it operates at two stages of the buying journey. First, it determines whether a shopper clicks on your listing from search results. Second, it sets the quality expectation for everything else on your listing page. A strong main image can increase conversion by up to 25%.
The “1-second test” is the principle that a shopper scrolling through Amazon search results gives your main image approximately one second to communicate three things:
- What is this product? (Category recognition)
- Is it high quality? (Production value perception)
- Is it relevant to what I searched for? (Relevance confirmation)
If your main image fails any of these three checks, the shopper scrolls past and your listing never gets a chance to convert them.
Main image best practices for conversion:
- Fill 85%+ of the frame. Products photographed small against white space look cheap. Fill the frame so the product dominates the thumbnail in search results.
- Use professional lighting that shows texture and dimension. Flat, evenly-lit images look generic. Slight shadows and highlights show that this is a real, quality product.
- Show the product at its most recognisable angle. Not the most artistic angle – the angle that makes it instantly clear what this product is.
- Include scale reference where appropriate. If size matters for your product (water bottles, bags, organisers), show it in a way that communicates dimensions without a human model (which Amazon restricts on main images).
- Minimum 2000×2000 pixels. This enables the zoom function, which BigCommerce research shows increases conversion by allowing detail inspection.
Common main image mistakes that kill conversion: using lifestyle images (against Amazon guidelines for main image), showing the product from an unusual angle that makes identification difficult, low resolution that prevents zoom, and including text or badges that look spammy in thumbnails.
Same product. Better listing. More sales.
Title Optimisation for Conversion
Your product title serves dual purposes for conversion. On the search results page, it confirms relevance (“yes, this is what I searched for”). On the product detail page, it provides the first piece of textual information the shopper processes.
The data from Amazon A/B tests shows that titles optimised for conversion (not just SEO) can improve Unit Session Percentage by 10-15%. The key insight: conversion-optimised titles balance keyword inclusion with readability and benefit signaling.
Title structure for maximum conversion:
- Lead with primary keyword + brand: “Brand Name – Stainless Steel Insulated Water Bottle” confirms relevance immediately
- Include the key differentiator: What makes yours different from the 50 other results? Size, material, unique feature?
- Add benefit signal: “Keeps Drinks Cold 24 Hours” converts better than “Double-Wall Vacuum Insulated” because it speaks to outcome, not specification
- Specify variant details: Size, colour, quantity – so the shopper knows they have found the exact variant they want
Title mistakes that hurt conversion: keyword stuffing that makes the title unreadable (shoppers subconsciously associate messy titles with low-quality products), missing key specifications that force the shopper to dig deeper for basic information, and using overly creative language that obscures what the product actually is.
For most categories, keep titles between 150-200 characters. Amazon truncates at different lengths on mobile versus desktop versus search results, so front-load the most important information. The first 60-80 characters must work as a standalone title because that is often all that displays in search results on mobile.
Bullet Point Structure for Conversion
Bullet points are where conversion is won or lost for considered purchases. Research on what shoppers actually read on product listings shows that bullets receive 4-5x more reading time than any other listing element after the image. They are where buyers confirm their purchase decision or find a reason to leave.
The optimal bullet point structure for conversion follows this pattern:
Bullet 1: Primary benefit / main use case. What is the number one reason someone buys this product? Lead with that. Not a feature – the benefit that feature delivers. “Keeps coffee hot for 12 hours on your commute” not “Double-wall vacuum insulation technology.”
Bullet 2: Key differentiator. What makes this product different from the other results the shopper is comparing? This is where you earn the right to be chosen over alternatives. Be specific: “3mm thicker steel than standard bottles – won’t dent when dropped” is differentiation. “Premium quality” is not.
Bullet 3: Address the #1 objection. Look at negative reviews in your category. What is the most common complaint? Address it pre-emptively. “Leak-proof lid tested at 50 PSI – we guarantee zero drips in your bag” counters the most common water bottle complaint.
Bullet 4: Social proof or specificity. “Used by 50,000+ commuters daily” or exact specifications that confirm fit for purpose. Concrete numbers convert better than vague claims.
Bullet 5: Risk reversal. Warranty, guarantee, or inclusion details that reduce purchase anxiety. “Lifetime warranty – if it ever leaks, we replace it free” removes the last barrier to clicking Buy.
Critical rule: front-load each bullet. The most important word should be the first word. On mobile, bullets are truncated after approximately 100 characters in the collapsed view. If your benefit is buried at the end of a 250-character bullet, mobile shoppers never see it.
Price Perception: How to Frame Price Without Being Cheapest
Price is a conversion factor, but not in the way most sellers think. The cheapest product does not always win. In fact, in many categories, the cheapest option converts worse because shoppers perceive low price as a quality signal. What kills conversion is not high price – it is unjustified high price or price that is misaligned with perceived value.
Price perception is shaped by several factors that you can influence through your listing:
- Price relative to visible alternatives. If the search results page shows 10 similar products between $15-$25 and yours is $45, your listing must immediately communicate why. The image, title, and first bullet need to signal premium quality that justifies the gap.
- Price per unit for multi-packs. A 3-pack at $27 ($9/unit) can convert better than a single at $12 because the per-unit value is visible. Amazon now shows unit pricing in many categories – use this to your advantage.
- Coupon and deal visibility. A product at $29.99 with a visible 15% coupon converts better than the same product simply priced at $25.49. The perceived deal triggers action. The coupon badge in search results also increases click-through rate by 10-15%.
- Subscribe and Save discount. For consumable products, showing the S&S price alongside the one-time price creates an anchoring effect and signals that this is a product people buy repeatedly – social proof through pricing structure.
The practical approach: position your price within 10-20% of the category average unless you can clearly demonstrate premium value through superior imagery, reviews, and benefit communication. If you are priced above average, every element of your listing needs to reinforce why.
Review Velocity and Its Effect on Conversion
Reviews are the second most impactful element for conversion after the main image. But it is not just the total review count that matters – review velocity (the rate of new reviews appearing) signals ongoing product quality and active sales to both shoppers and Amazon’s algorithm.
The conversion impact of reviews follows a logarithmic curve:
- 0 to 5 reviews: Massive conversion increase (often 2-3x improvement)
- 5 to 15 reviews: Significant continued improvement (50-80% increase from 5)
- 15 to 50 reviews: Moderate improvement (20-30% increase from 15)
- 50 to 100 reviews: Diminishing returns (10-15% increase from 50)
- 100+ reviews: Marginal gains (mostly about maintaining star rating)
The critical threshold is 15 reviews. Below this number, many shoppers consider the product “unproven” regardless of how good those few reviews are. Getting to 15 genuine reviews should be treated as an urgent priority for any product launched on Amazon.
Star rating matters more than review count once you pass 15 reviews. Northwestern University research found that the ideal star rating for conversion is 4.2-4.5 – not 5.0. Perfect 5-star ratings actually reduce trust because shoppers suspect fake reviews. A product at 4.3 stars with 200 reviews will outconvert a product at 5.0 stars with 12 reviews every time.
How to maintain healthy review velocity without violating Amazon TOS:
- Enrol in the Amazon Vine programme for new products (up to 30 free units for honest reviews)
- Use the “Request a Review” button in Seller Central (compliant, automated follow-up)
- Include product inserts that encourage reviews (without incentivising positive ones)
- Focus on product quality – the best review strategy is selling a genuinely good product
- Monitor and respond to negative reviews through Amazon’s buyer messaging system
A+ Content: Measurable Conversion Lift
Amazon’s own published data states that A+ Content (formerly Enhanced Brand Content) delivers a 3-10% conversion rate improvement. This is a wide range because the impact depends entirely on execution quality and product type. Visual products and products requiring education see the highest lift. Simple, commodity products see minimal impact.
What makes A+ Content convert rather than just look nice:
- Comparison charts against your own products. Not competitor comparisons (which Amazon restricts) but showing how your product range differs. This keeps shoppers in your brand ecosystem rather than bouncing to competitors.
- Lifestyle imagery showing the product in use. Your main images must be on white background, but A+ lets you show context – the product in a real kitchen, being used during exercise, on a bedside table. This helps shoppers visualise ownership.
- Objection handling through visuals. Show the product being dropped (durability), show the seal mechanism close-up (leak proof), show the size in hand (scale). Answer objections before they form.
- Feature-benefit mapping. Not just “what it has” but “what that means for you.” A labelled image connecting features to real-world benefits converts better than a feature list.
A+ Content modules that perform best for conversion: the comparison table (highest engagement), the full-width image with text overlay (brand storytelling), and the four-image text module (feature breakdown). Avoid the pure text modules – if shoppers wanted to read paragraphs of text, they would read the description. A+ is visual-first.
One underutilised tip: use Premium A+ Content if you qualify. It includes video modules, interactive hotspots, and carousel modules that can increase conversion by an additional 5-8% over standard A+. Brands typically qualify after publishing 5 approved A+ content submissions and getting Brand Story accepted.
Mobile Conversion: Why It Is Lower and How to Fix It
Mobile accounts for approximately 70% of Amazon traffic but converts 15-20% lower than desktop. Statista data confirms this gap is consistent across e-commerce, but on Amazon specifically, it represents a massive optimisation opportunity because the traffic volume is so high.
Why mobile converts lower:
- Truncation. Titles show only 60-80 characters. Bullets show approximately 100 characters before collapse. If your key information is buried after these thresholds, mobile shoppers never see it.
- Smaller image viewing area. The detail and quality of your images is harder to appreciate. Images that rely on fine detail or text overlays fail on mobile.
- Scrolling behaviour. Mobile shoppers scroll faster and more impulsively. You have fewer seconds to capture attention and make the case for purchase.
- More likely to be distracted. Mobile shopping often happens during commutes, in queues, or while watching TV. The purchase decision competes with other stimuli.
How to optimise for mobile conversion:
- Front-load everything. First 60 characters of title, first 100 characters of each bullet, first image – these must carry the full conversion argument.
- Make main image simple and bold. Complex images with small details do not work at mobile thumbnail size. The product should fill the frame and be instantly recognisable.
- Use the image carousel strategically. Mobile shoppers swipe through images more than desktop shoppers click thumbnails. Image 2 should be your strongest benefit visualisation, not a back-of-pack shot.
- Ensure A+ Content is mobile-readable. Text on images should be at least 24pt equivalent. Comparison tables should have no more than 3 columns (4+ columns become unreadable on phone screens).
- Preview your listing on a phone. Open your listing URL on a mobile device and evaluate: can a shopper understand and buy in under 30 seconds?
Same product. Better listing. More sales.
Seasonal Conversion Patterns and How to Account for Them
Conversion rates are not static throughout the year. Understanding seasonal patterns prevents you from making reactive optimisation decisions based on natural fluctuations rather than actual listing problems.
Typical seasonal conversion patterns:
- Q4 (October-December): Conversion rates peak, particularly during Prime Day, Black Friday, and the Christmas shopping period. Gift shoppers have high purchase intent and are less price-sensitive. Expect 20-40% above your annual average.
- January: Conversion dips as shoppers switch to browsing mode, using gift cards, and comparison shopping. Budget tightening after holiday spending reduces impulse purchases.
- Q2 (April-June): Steady-state conversion for most categories. Good baseline period for measuring optimisation impact.
- Prime Day (July): Massive traffic spike with elevated conversion due to deal expectations and urgency. Listings not participating in deals may see conversion drop as traffic gets diverted.
Category-specific seasonality also matters. Fitness products see January conversion spikes (New Year resolutions). Outdoor products peak in spring. Back-to-school categories peak August-September. Health supplements see post-holiday detox interest.
How to account for seasonality in your optimisation strategy:
- Compare conversion rates year-over-year for the same period, not month-over-month
- Make listing changes during steady-state periods (Q2) so you can accurately measure impact
- Do not panic if January conversion drops 15% – it is likely market-wide, not listing-specific
- Prepare listing optimisations in advance of peak periods to capture seasonal traffic at maximum efficiency
- Use Amazon’s Manage Your Experiments feature during high-traffic periods for faster statistical significance
Putting It All Together: The Conversion Rate Improvement Framework
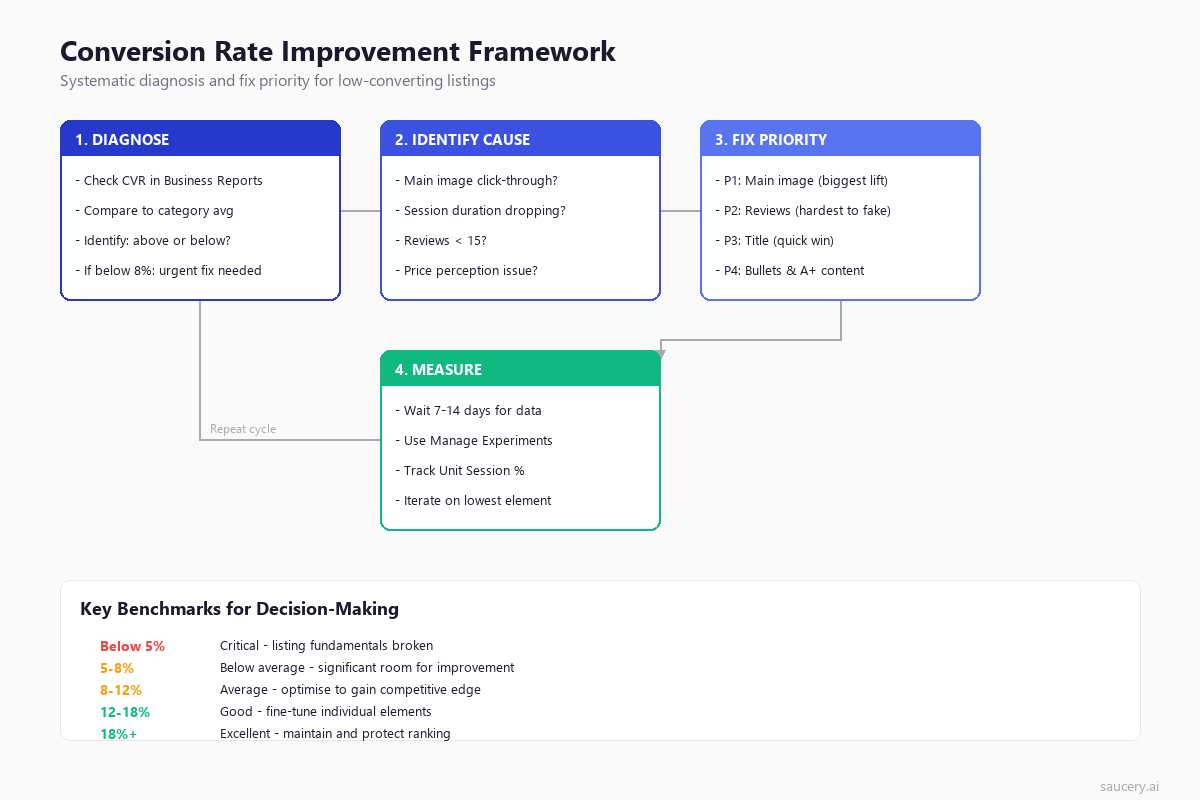
Improving your Amazon conversion rate is not about making random listing changes and hoping something works. It is a systematic process of diagnosis, prioritisation, execution, and measurement. Here is the framework that consistently delivers results:
Step 1: Establish your baseline. Pull 60-90 days of data from Business Reports. Calculate your average Unit Session Percentage and compare to category benchmarks above. Determine the gap between your current performance and category average.
Step 2: Diagnose the primary cause. Look at your listing through the lens of the conversion killers list. Compare your main image to the top 3 organic results. Read your bullets as if you were a first-time shopper. Check your review count and star rating. Identify the weakest element relative to competitors.
Step 3: Fix in priority order. Address the highest-impact element first (usually main image or reviews for underperforming listings). Make one change at a time if possible, so you can attribute results. Use Manage Your Experiments for A/B testing where available.
Step 4: Measure and iterate. Wait 14-21 days for statistically meaningful data. Compare the same metric (Unit Session Percentage) before and after. If improvement is confirmed, move to the next priority element. If not, revise your hypothesis and test a different approach.
The compounding effect of this systematic approach is significant. Improving main image (+10% conversion), then title (+8%), then bullets (+5%) does not add up to 23% – it compounds. A listing converting at 10% that achieves these three improvements ends up closer to 12.5%, which triggers ranking improvements that bring more high-intent traffic, which further improves conversion. The flywheel builds momentum.
Frequently Asked Questions
What is a good Amazon conversion rate?
A good Amazon conversion rate is 12-15% for most categories. However, “good” depends entirely on your specific category. Electronics at 10% is good. Health and Personal Care at 10% is below average. Compare your Unit Session Percentage to the category benchmarks in this article rather than using a universal number.
How do I check my Amazon conversion rate?
Go to Seller Central > Reports > Business Reports > Detail Page Sales and Traffic by Child Item. The “Unit Session Percentage” column is your conversion rate. Use at least a 30-day date range for meaningful data, and remember there is a 48-72 hour reporting delay.
Why is my Amazon conversion rate dropping?
Common reasons for conversion rate drops: new competitors entering with lower prices or better listings, seasonal traffic shifts (January browsing traffic converts lower), loss of Buy Box share, accumulation of negative reviews, or Amazon algorithm changes affecting which traffic reaches your listing. Check if the drop correlates with any of these factors before making listing changes.
Does PPC traffic have a different conversion rate than organic?
Yes. PPC (Sponsored Products) traffic typically converts 10-30% lower than organic traffic because it includes shoppers who are less specifically searching for your product. Branded search terms convert highest, followed by specific long-tail keywords, followed by broad category terms. If you are running heavy PPC on broad terms, expect your overall conversion rate to decrease even as total sales increase.
How long does it take to improve conversion rate?
Image and title changes can show measurable impact within 7-14 days. Review accumulation takes longer (weeks to months depending on sales volume). A+ Content typically needs 2-4 weeks to reflect in data. The full flywheel effect – where improved conversion leads to better ranking leads to more high-intent traffic – usually takes 4-8 weeks to fully materialise.
Does Amazon conversion rate affect ranking?
Yes, significantly. Amazon’s A10 algorithm uses conversion rate as one of its primary ranking signals. Higher conversion rate leads to better organic placement, which leads to more traffic from high-intent searches, which maintains conversion rate. This flywheel effect means that conversion rate optimisation is simultaneously an Amazon SEO strategy.
What is the difference between Unit Session Percentage and Order Session Percentage?
Unit Session Percentage counts total units sold divided by sessions. Order Session Percentage counts total orders divided by sessions. If a customer orders 3 units in one transaction, Unit Session Percentage counts 3 but Order Session Percentage counts 1. For most sellers, Unit Session Percentage is the more relevant metric because it reflects actual revenue generation per visitor.
Can I have too high a conversion rate?
Not really, with one caveat. Extremely high conversion rates (30%+) sometimes indicate your product is priced too low relative to perceived value – you could raise prices and maintain strong conversion while increasing profit per unit. But from a pure listing performance perspective, higher conversion is always better for ranking and profitability.
About the Author
Andrew Mac is the founder of Saucery, where he builds AI-powered tools that help brands optimise product listings using modelled shopper behaviour. Before Saucery, he spent a decade in FMCG product development and e-commerce, watching brands make avoidable listing mistakes that cost them millions in lost conversion. He writes about Amazon optimisation, product strategy, and the intersection of AI and e-commerce.
Subscribe for F&B Consumer Insights
Data-driven insights on food & beverage consumer preferences, straight to your inbox.