You have a product listing on Amazon that is converting at 12%. You suspect the title could perform better. You suspect the main image is not optimised. You suspect your bullet points are burying the lead.
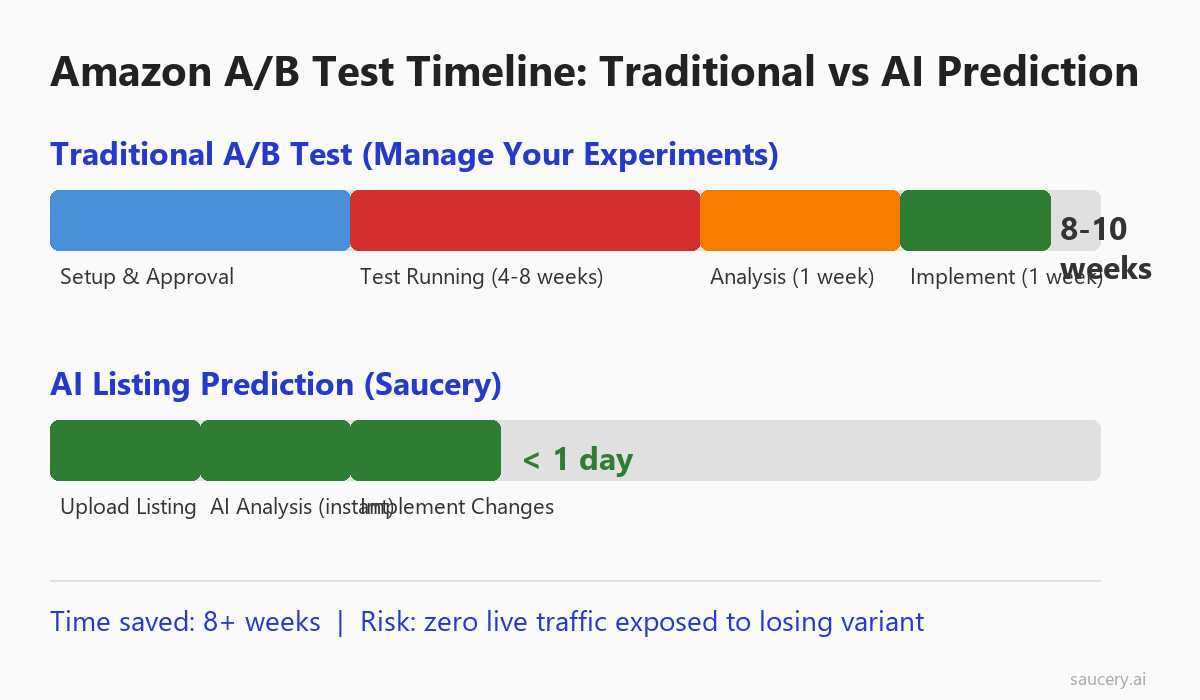
So you set up an A/B test through Amazon’s Manage Your Experiments tool. Eight weeks later, you get a result – but only for one element. Meanwhile, your competitor tested three variations using predictive AI and implemented changes in a single afternoon.
Amazon A/B testing is a powerful capability that most sellers either ignore entirely or execute poorly. The platform gives you real shopper data, which is invaluable. But the constraints – minimum traffic thresholds, mandatory run durations, and the risk of exposing half your traffic to a losing variant – mean that traditional split testing is not always the fastest or safest path to Amazon listing optimisation.
This guide covers everything: how Manage Your Experiments works, what you can test, how to interpret results, and when predictive alternatives give you better outcomes with less risk. Whether you are running your first experiment or evaluating whether live testing is even the right approach for your catalogue, this is the complete framework.
Table of Contents
- What Is Amazon A/B Testing?
- Requirements and Eligibility
- Why Tests Take 8+ Weeks
- What You Can Test on Amazon
- The Cost of Running a Bad Variant
- How to Decide What to Test First
- Step-by-Step Setup Guide
- How to Read and Interpret Results
- Alternative Approaches to Amazon Testing
- When AI Prediction Beats Live Testing
- Common A/B Testing Mistakes to Avoid
- Frequently Asked Questions
What Is Amazon A/B Testing (Manage Your Experiments)?
Amazon A/B testing – officially called “Manage Your Experiments” – is Amazon’s native split testing tool that lets brand-registered sellers test different versions of their product listing content against each other using real shopper traffic.
The concept is straightforward: you create two versions of a listing element (say, two different product titles), and Amazon randomly shows each version to roughly half your visitors. After enough data accumulates, you get a statistically backed answer about which version drives more sales.
Amazon launched this capability in 2019, initially limited to A+ Content testing. It has since expanded to cover titles, main images, bullet points, and brand stories. The tool lives in Seller Central under Brands > Manage Your Experiments.
What makes this different from external tools or manual split tests is that Amazon controls the traffic allocation, handles the statistical calculations, and ensures clean data by randomising at the session level. A shopper who sees Version A on Monday will continue seeing Version A throughout the test period – eliminating contamination from repeat visits.
The mechanism works through Amazon’s internal content delivery system. When a shopper arrives at your listing, Amazon’s algorithm checks whether they have been previously assigned to a variant group. New visitors are randomly assigned to either the control (your current listing) or the treatment (your test variant). This assignment persists across sessions, devices, and browsing contexts for that customer, ensuring each data point represents an independent user experience.
The downside? Speed. Amazon requires a minimum test duration (typically 4 weeks for titles, 8-10 weeks for content) and needs sufficient traffic volume to reach statistical significance. For many sellers, this means waiting two months to learn whether a product title optimisation actually moved the needle.
Requirements and Eligibility
Not every seller can run A/B tests on Amazon. Here are the prerequisites you need to meet before accessing Manage Your Experiments.
Brand Registry Enrollment
You must be enrolled in Amazon Brand Registry. This requires an active registered trademark in the country where you want to test. If you are selling under a generic or unregistered brand, Manage Your Experiments is not available to you. The trademark must be text-based or image-based and registered with the relevant government intellectual property office (USPTO for US, IPO for UK, IP Australia for AU).
Traffic Minimums
Amazon does not publish exact traffic thresholds, but based on seller reports and Amazon’s own documentation, you typically need:
- Minimum sessions: Approximately 100-200 sessions per week for the ASIN being tested
- Active sales history: The product needs established sales velocity – new launches with minimal traffic will not qualify
- Sufficient conversion data: Amazon needs enough purchase events to calculate statistical significance
- Consistent traffic patterns: Products with highly irregular traffic (extreme spikes and troughs) may face additional hurdles
If your product does not meet these thresholds, the “Create a New Experiment” button will either be greyed out or you will receive an eligibility error after selecting your ASIN. There is no workaround – you cannot force eligibility through increased PPC spend or other traffic manipulation.
Duration Constraints
Minimum and recommended durations vary by test type:
- Product titles: 4-week minimum, 8 weeks recommended
- Main images: 4-week minimum, 6-8 weeks recommended
- A+ Content: 8-week minimum, 10 weeks recommended
- Bullet points: 4-week minimum, 8 weeks recommended
- Brand Story: 8-week minimum, 10 weeks recommended
These durations exist because Amazon needs to account for day-of-week effects, purchase cycles, and natural traffic variance. A Monday-only spike in conversions is not the same as a sustained improvement across all shopping patterns. Amazon’s algorithm also needs sufficient time to detect small but meaningful differences – a 5% relative improvement in conversion rate requires substantially more data than a 30% improvement.
Why Amazon A/B Tests Take 8+ Weeks to Deliver Results
Understanding why tests take so long helps you decide whether the wait is worth it – or whether alternative approaches serve you better for specific optimisation decisions.
Statistical Significance Requirements
Amazon uses a Bayesian statistical model to determine whether one variant genuinely outperforms another. To reach 95% confidence (the standard threshold for declaring a winner), you need enough conversion events on both variants to rule out random chance.
For a product converting at 15% with 50 sessions per day, splitting traffic 50/50 means each variant gets roughly 25 sessions daily. At that rate, detecting a 10% relative improvement in conversion requires approximately 3,800 sessions per variant – or about 10-11 weeks of data collection. According to Jungle Scout’s analysis of A/B testing data, the median time to statistical significance for Amazon experiments is 8.2 weeks.
Traffic Splitting Dilutes Signal
Because Amazon splits your traffic evenly between variants, each version receives only half your normal sessions. This means the effective sample size accumulates at half the rate of your total traffic. A product getting 100 sessions per day effectively provides only 50 sessions per day per variant for statistical calculations.
The mathematics are unforgiving. Sample size requirements for detecting a given effect size scale with the square of the precision you need. Halving your effective traffic does not double the required time – it actually more than doubles it because each variant needs its own sufficient sample independently.
Weekly Cycle Normalisation
Shopping behaviour varies significantly by day of week. Tuesday traffic converts differently than Sunday traffic. Amazon shoppers buying office supplies on Monday morning behave differently than those browsing home goods on Saturday evening. Amazon’s algorithm needs multiple complete weekly cycles to ensure a result is not skewed by day-of-week patterns. This is why even high-traffic products cannot reliably conclude tests in under 4 weeks.
Small Effect Sizes Need Large Samples
The most common outcome of listing optimisation is a 5-15% relative improvement in conversion rate. Detecting a 5% relative improvement (say, from 15% to 15.75% conversion) requires substantially more data than detecting a 30% improvement. Since most optimisations produce modest gains, the tests need to run longer to distinguish signal from noise.
Research from Helium 10 confirms that 67% of Amazon A/B tests end inconclusively because sellers terminate them before sufficient data accumulates. Patience is not optional – it is a prerequisite for valid results.
Seasonality and External Noise
Beyond weekly patterns, Amazon’s algorithm must account for broader traffic fluctuations – promotional events, competitor actions, seasonal demand shifts, and advertising changes. A test running during a two-week period where your PPC spend doubled will produce different baseline metrics than a test during normal trading. The extended duration helps smooth out these external noise factors and produce results that reflect genuine listing performance differences rather than environmental changes.
Same product. Better listing. More sales.
What You Can A/B Test on Amazon
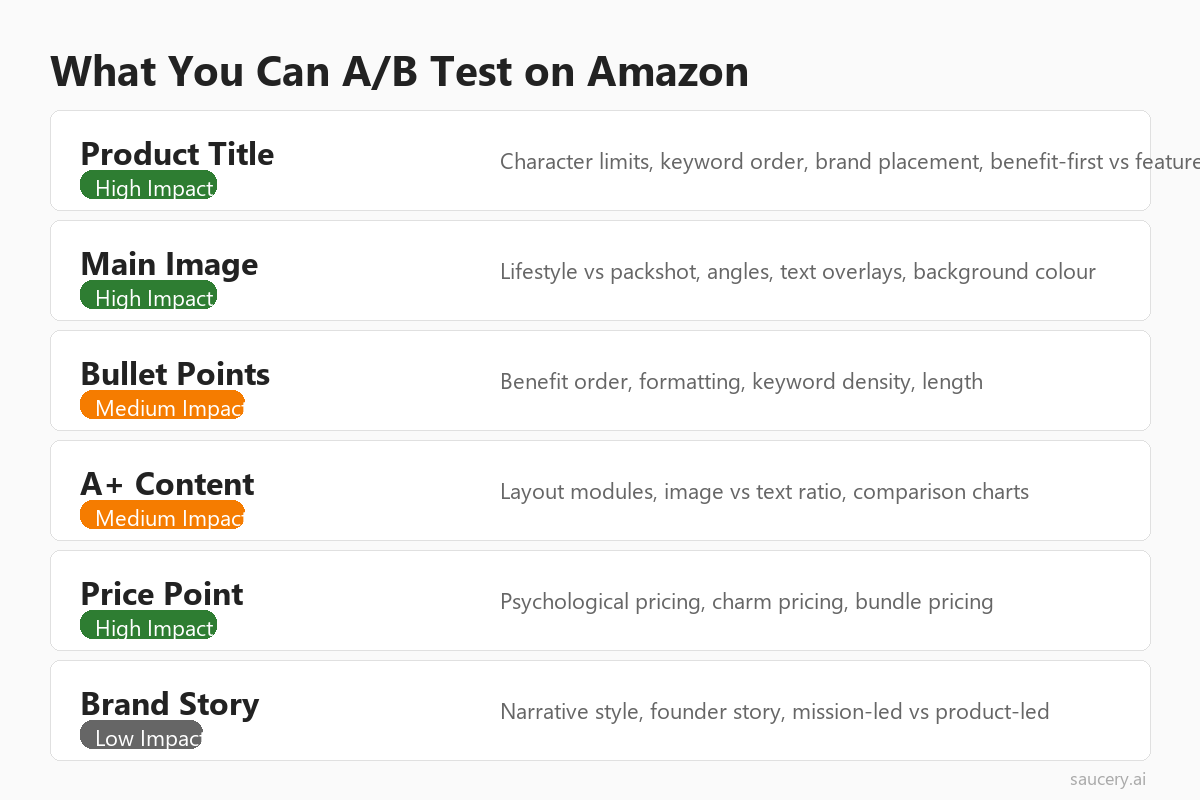
Manage Your Experiments currently supports testing five listing elements. Each has different characteristics in terms of impact potential, setup complexity, and time to significance.
Product Titles
Title tests have the highest potential impact on both click-through rate (from search results) and conversion rate (on the listing page). Your product title is the single most visible element in search results and directly influences whether shoppers click through.
What to test in titles:
- Keyword order: “Organic Protein Powder Vanilla 2lb” vs “Vanilla Protein Powder – Organic, 2lb Tub”
- Benefit-first vs feature-first: Leading with the outcome (“Fast-Absorbing Whey Protein”) vs the specification (“25g Whey Protein Isolate”)
- Brand prominence: Brand name first vs buried mid-title
- Character utilisation: Short punchy titles (80 chars) vs maximum-length keyword-rich titles (200 chars)
- Separator style: Dashes vs pipes vs commas
- Audience specificity: Generic (“Protein Powder”) vs targeted (“Protein Powder for Women Over 40”)
According to Amazon’s own Seller Central style guides, titles should be under 200 characters and follow a specific format. But within those constraints, the variations that actually drive clicks are surprisingly hard to predict without testing. The first 60-80 characters matter most because that is all that displays on mobile search results – and mobile now accounts for over 60% of Amazon traffic.
Main Images
Your main image is the primary click driver from search results. A/B testing images can reveal whether lifestyle photography, specific angles, or particular product presentations drive more engagement. Research from Baymard Institute shows that product image quality directly correlates with perceived product quality and purchase intent.
Image test ideas:
- Product angle (front vs 3/4 view vs in-use)
- Background variations within Amazon’s white background requirement
- Zoom level (full product vs close-up detail)
- With vs without packaging
- Scale indicators (product next to recognisable objects)
- Product count visibility (showing all items in a multipack vs a single unit)
Main image tests often produce the most dramatic results because the image determines whether shoppers even click through from search results. A 20% improvement in click-through rate from a better main image compounds across every search impression your product receives – potentially thousands of additional clicks per month at zero incremental cost.
Bullet Points
Amazon bullet points sit in the critical decision zone of the listing page. They are where shoppers go to validate their purchase intent or find the reason not to buy. Testing bullet points reveals which benefits matter most to your specific audience.
Research on what shoppers actually read on product listings shows that bullet point order matters enormously – the first two bullets receive 3-4x the attention of bullets four and five. This means a simple reordering (moving your strongest benefit to position one) can meaningfully improve conversion without writing a single new word.
Bullet point test variables:
- Benefit hierarchy: Which benefit leads? Taste, health, convenience, value?
- Format: Capitalised lead-in phrases vs flowing sentences
- Length: Short scannable bullets (1 line) vs detailed bullets (2-3 lines)
- Specificity: “Made with real ingredients” vs “Made with 100% grass-fed New Zealand whey”
- Social proof integration: Including review highlights in bullets vs pure feature/benefit copy
- Objection handling: Addressing common concerns (allergens, sourcing, guarantees) vs pure benefit statements
A+ Content (Enhanced Brand Content)
A+ Content testing is where Amazon’s tool originally launched. You can test entirely different A+ layouts against each other – different module combinations, image-to-text ratios, comparison charts vs lifestyle storytelling.
A+ Content typically influences conversion rate rather than click-through rate, since shoppers only see it after scrolling down the listing page. But for considered purchases (supplements, electronics, premium food products), the below-the-fold content often makes the difference between “add to cart” and “keep browsing.” Amazon’s internal data suggests A+ Content can improve conversion rates by 3-10% on average, with well-designed content at the higher end of that range.
Test variables for A+ Content include layout structure (single-column vs multi-column), image-to-text ratio (visual-heavy vs copy-heavy), inclusion of comparison charts, lifestyle imagery vs product-focused imagery, and the presence or absence of brand story elements. The most impactful A+ tests typically involve fundamentally different approaches rather than minor copy tweaks.
Pricing
Product pricing strategy testing on Amazon is more nuanced than simply trying a higher and lower price. Price changes affect your Buy Box eligibility, profit margins, and competitive positioning simultaneously. While Manage Your Experiments does not natively support price A/B testing, sellers use complementary approaches to test price sensitivity.
Understanding the difference between markup and margin is essential before running any pricing tests – a 10% price increase does not translate linearly to a 10% margin improvement when you account for volume changes. The elasticity of demand varies dramatically by category, price point, and competitive density.
The Cost of Running a Bad Variant Live
Here is the part nobody talks about enough: while your A/B test runs, half your traffic sees whatever variant you created. If that variant is worse than your current listing, you are actively losing sales for 4-10 weeks.
The Maths of a Losing Variant
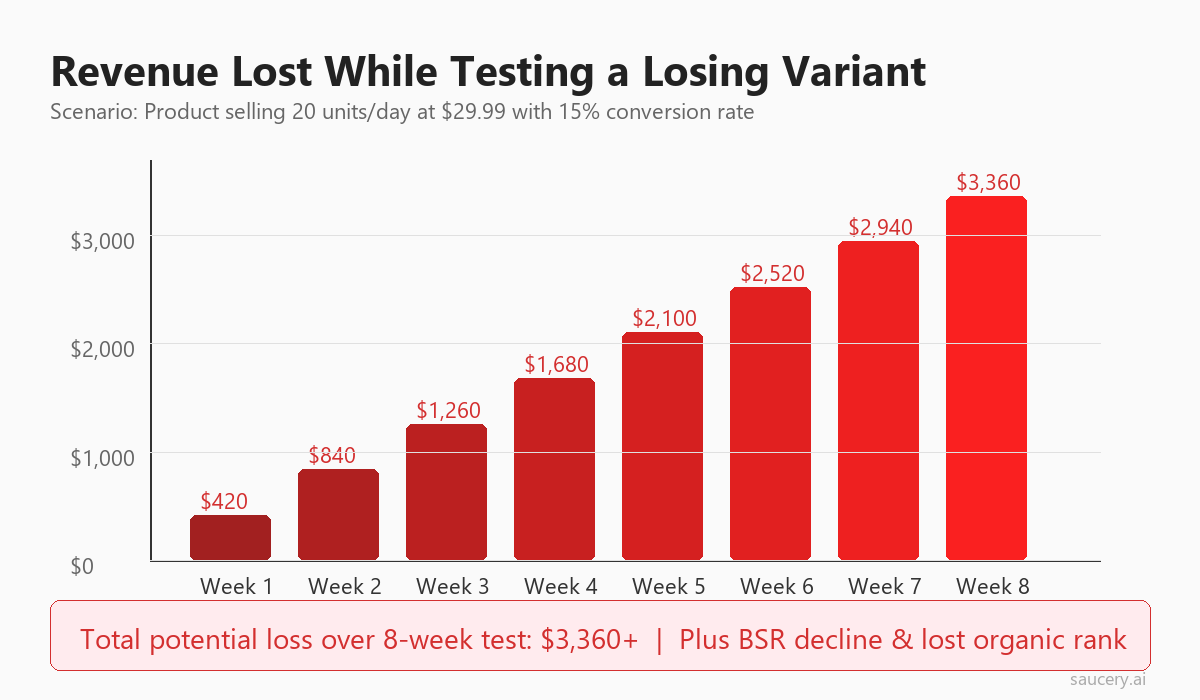
Consider a product doing 20 units per day at $29.99 with a 15% conversion rate. If your test variant converts at 12% instead of 15% (a 20% relative decline):
- Daily lost sales: Half your traffic sees the worse variant. That is 10 potential daily units exposed to a 12% conversion rate instead of 15%, losing approximately 2 sales per day
- Weekly revenue loss: 2 sales x $29.99 x 7 days = $420 per week
- 8-week total: $3,360 in direct revenue loss
- Compounding effects: Lower sales velocity reduces BSR, which reduces organic visibility, which reduces sessions – creating a downward spiral that persists after the test ends
And this is a conservative scenario. Products with higher price points, higher traffic, or larger conversion deltas can lose significantly more. A $59.99 product losing 4 sales per day bleeds $1,680 per week – over $13,000 across an 8-week test. That is not a testing cost most growing brands can absorb without consequence.
BSR and Ranking Impact
Amazon’s Best Sellers Rank responds to sales velocity in near real-time. During an A/B test with a losing variant, your overall conversion rate drops, which means fewer sales, which means BSR decline. Depending on your category competitiveness, recovering lost BSR positions can take 2-4 weeks after the test concludes.
This creates a hidden cost: even after you declare a winner and implement it, you spend additional weeks recovering the organic positioning you lost during the test. For products in competitive niches, this ranking impact can exceed the direct revenue loss. A drop from position 3 to position 8 in your main keyword results in dramatically fewer organic sessions – sessions you were not paying for through advertising.
Review Velocity Disruption
Fewer sales means fewer reviews. For products actively building their review base (under 100 reviews), an 8-week period of suppressed sales can delay reaching critical review thresholds. According to Jungle Scout’s Consumer Trends Report, 79% of Amazon shoppers check reviews before purchasing, making review velocity a compounding growth factor that feeds back into conversion rate.
Advertising Efficiency Decline
If you are running PPC campaigns during an A/B test, half your paid traffic lands on the potentially inferior variant. Your advertising cost per acquisition (ACoS) increases because conversion rate drops on that traffic segment. You are paying the same cost-per-click but generating fewer sales – effectively inflating your advertising costs for the duration of the test without any corresponding budget adjustment.
Same product. Better listing. More sales.
How to Decide What to Test First (Impact vs Effort Matrix)
You cannot test everything simultaneously on Amazon. Each test requires 4-10 weeks, and you can only run one experiment per ASIN at a time. This means prioritisation is not optional – it is the difference between optimising your listing in 3 months versus 18 months.
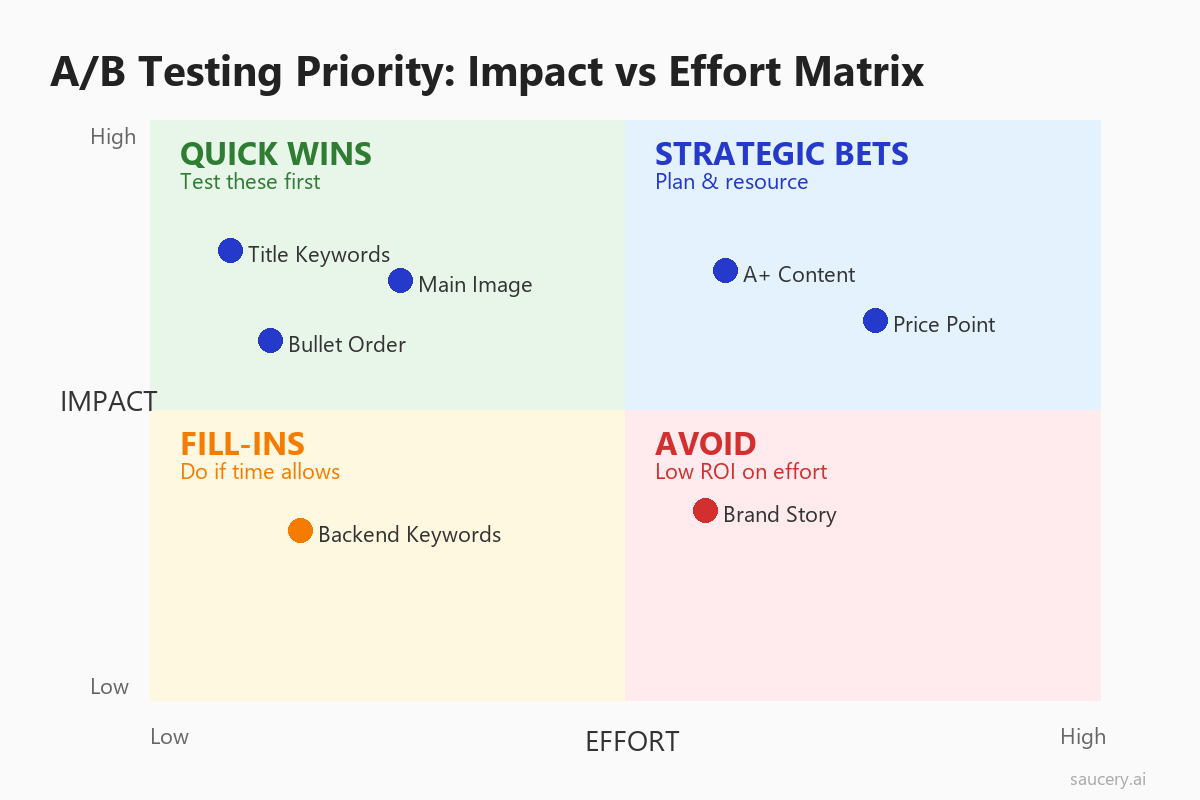
Quick Wins: High Impact, Low Effort
Title keyword order: Rearranging your existing keywords costs nothing and can dramatically affect both search visibility and click-through rate. If your title currently leads with your brand name but your brand has low recognition, moving the primary benefit keyword to position one is a high-probability win.
Main image angle: If you already have multiple product photography angles, testing a different hero image is zero-cost and affects the highest-visibility element of your listing.
Bullet point order: Reordering existing bullets requires no new copywriting – just a hypothesis about which benefit matters most to your buyers. Start here if your bullets are well-written but you are unsure of the priority sequence.
Strategic Bets: High Impact, High Effort
Complete A+ Content redesign: Creating a new A+ layout from scratch requires design resources and content strategy. But for products where the below-fold experience is critical to conversion (complex products, premium pricing, products requiring education), this is where the biggest conversion gains live.
Price point testing: Changing your price affects margins, Buy Box dynamics, and competitive positioning simultaneously. The potential upside is enormous but the variables are complex. This is a test you want to get right on the first attempt.
Understanding your product differentiation and unique selling proposition should inform what you test. If your USP is unclear even to you, no amount of A/B testing will fix a positioning problem – you need to solve the strategy question before optimising the execution.
Fill-Ins: Low Impact, Low Effort
Backend search terms: Not directly testable through Manage Your Experiments, but low-effort to iterate. Change them monthly based on search term reports and track conversion rate shifts.
Secondary images: Gallery images beyond the main image have lower individual impact but are easy to swap and test manually through conversion rate monitoring.
Avoid: Low Impact, High Effort
Brand Story complete overhaul: Brand Story sections have low visibility (buried at the bottom of listings on mobile), require significant design resources, and rarely produce measurable conversion lifts for most product categories. Test everything else first before investing in Brand Story experiments.
Step-by-Step Setup Guide for Manage Your Experiments
Here is exactly how to create and launch an A/B test on Amazon, from Seller Central through to live experiment and result collection.
Step 1: Navigate to Manage Your Experiments
Log into Seller Central. Go to Brands > Manage Your Experiments. If you do not see this option, either your brand is not registered or your account does not have the required permissions. Check that your IAM user has “Manage Experiments” permissions if you are using a sub-account.
Step 2: Select Your Experiment Type
Choose what you want to test:
- Product Title
- Main Image
- A+ Content
- Bullet Points
- Brand Story
Each type has different setup requirements and minimum durations. Start with titles or images if this is your first experiment – they produce results fastest and have the clearest impact on performance metrics you can track independently.
Step 3: Choose Your ASIN
Select the product you want to test. Amazon will show you whether the ASIN is eligible based on traffic volume and sales history. Products with fewer than approximately 100 weekly sessions may not qualify. If your target ASIN is not eligible, consider increasing traffic through PPC for 2-4 weeks before attempting again.
Step 4: Create Your Variant
Your current listing content becomes “Version A” (the control). You create “Version B” (the challenger). Key principles for variant creation:
- Change one thing at a time: If you change both keyword order AND add a benefit claim to your title, you will not know which change drove the result
- Make the change meaningful: Testing “Organic Protein Powder” vs “Organic Protein Powder ” (with a trailing space) teaches you nothing. The variants need to represent genuinely different hypotheses about what converts
- Have a hypothesis: “I believe leading with the use case will increase CTR because our search terms show intent-based queries” is better than “let us try something different”
- Stay within guidelines: Amazon will reject variants that violate listing policies, wasting your setup time
- Document your reasoning: Record why you chose this specific variation so you can build on the learning regardless of which variant wins
Step 5: Set Duration and Launch
Select your experiment duration. Amazon recommends specific minimum durations for each type, but longer is generally better for statistical power. Set a start date (experiments can be scheduled in advance) and submit for review.
Amazon typically reviews and approves experiments within 24-72 hours. Once approved, the experiment begins automatically on your selected start date. Avoid scheduling tests to start during major promotional events or immediately before/after significant advertising changes.
Step 6: Monitor (But Do Not Panic)
During the test, you can check progress in the Manage Your Experiments dashboard. You will see early directional data, but resist the urge to end the test prematurely. Early results are notoriously unreliable – Nielsen Norman Group research on A/B testing shows that tests ending before adequate sample sizes produce false positives 30-40% of the time.
Check in weekly to ensure nothing catastrophic is happening (massive conversion rate collapse suggesting a broken listing), but otherwise let the test run its full duration. The interim data is directional at best and misleading at worst.
Step 7: Evaluate and Implement
When the test concludes, Amazon presents the winner with a confidence score. If confidence exceeds 95%, implement the winner immediately. If confidence is between 70-95%, consider the directional signal but understand there is remaining uncertainty. Document the result and move to your next priority test.
How to Read and Interpret Amazon A/B Test Results
Amazon’s results dashboard provides several data points. Understanding what each means – and what it does not mean – is critical for making correct implementation decisions.
Probability of Being Best
This is Amazon’s primary metric – the probability that one variant is genuinely better than the other. A score of 95% means there is a 95% chance the winning variant truly outperforms the control, and a 5% chance the observed difference is due to random variation.
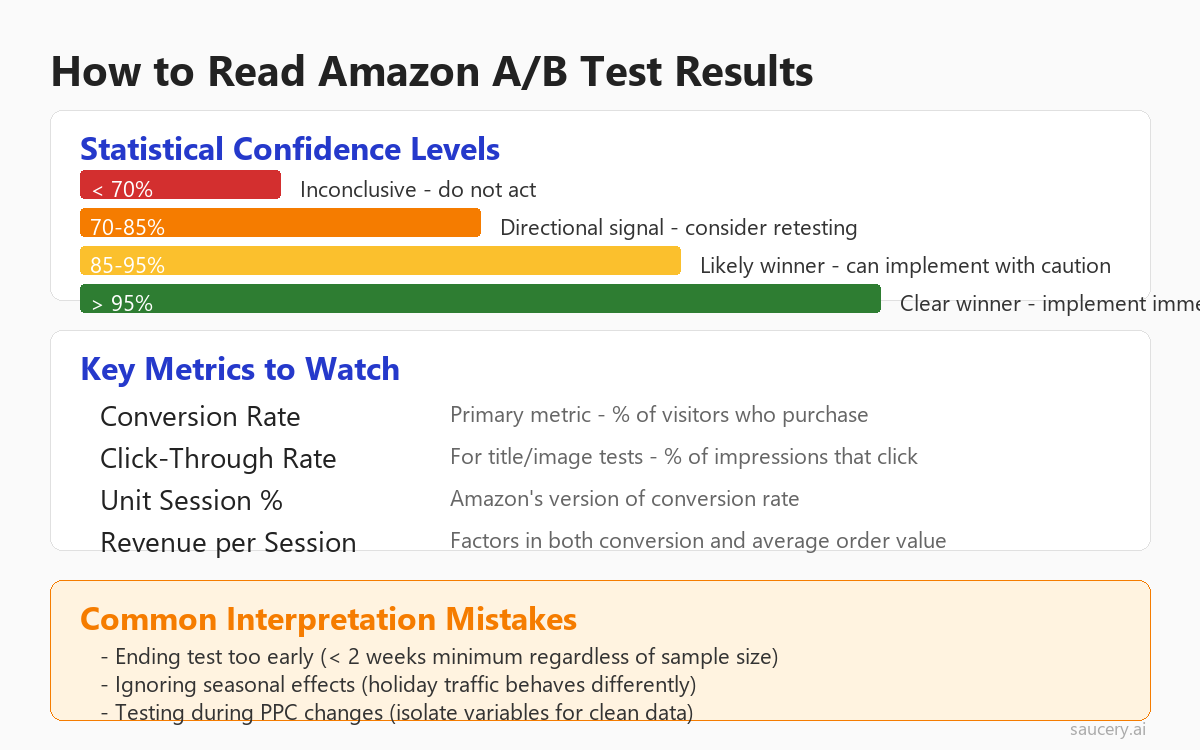
Interpretation thresholds:
- 95%+ confidence: Clear winner. Implement immediately.
- 85-95% confidence: Strong signal. Safe to implement but consider running a follow-up test to confirm.
- 70-85% confidence: Directional only. The difference may be real but you cannot be sure. Consider extending the test or retesting with more traffic.
- Below 70% confidence: Inconclusive. The variants perform similarly – either your change was too subtle or you need more data. Do not implement based on this.
Estimated Sales Impact
Amazon provides an estimated annual sales impact in dollar terms. This projection extrapolates the observed conversion difference across a full year of traffic at current levels. Treat this as directional rather than precise – your actual traffic, seasonality, and competitive landscape will cause variance from this projection. The estimate also assumes traffic remains constant, which rarely holds true for growing or seasonal products.
Conversion Rate Delta
The raw conversion rate difference between variants. A 0.5 percentage point improvement from 14.5% to 15.0% might seem small, but at scale, even fractional conversion improvements compound dramatically. On 100 daily sessions, that 0.5% improvement means 0.5 additional sales per day – or approximately $5,475 additional annual revenue at $30 average selling price.
Common Misinterpretations
Confusing statistical significance with practical significance: A result can be statistically significant (high confidence) but practically irrelevant (0.01% conversion improvement). Always evaluate whether the magnitude of improvement justifies the effort to implement and maintain the change.
Ignoring external factors: If your test ran during Prime Day, a competitor stock-out, or a seasonal demand spike, the results may not generalise to normal trading conditions. Always note what happened in your market during the test period.
Assuming results are permanent: Shopper preferences change. A winning variant in January may not win in July. Competitive listings evolve. Plan to retest every 6-12 months, especially for title and image experiments where the competitive context shifts continuously.
Over-indexing on a single metric: A variant that improves click-through rate but decreases conversion rate may not be a net positive. Always evaluate the full funnel impact – impressions to clicks to sales – rather than optimising one metric in isolation.
Same product. Better listing. More sales.
Alternative Approaches to Amazon Listing Testing
Manage Your Experiments is not the only way to optimise your listings. Several alternatives offer different trade-offs between speed, risk, and statistical rigour.
AI Prediction (Saucery)
Predictive AI evaluates listing variations without exposing any traffic to untested content. Instead of running live tests that risk losing sales, AI models analyse your listing elements against patterns from millions of purchase decisions to predict which variant will perform better.
The approach works by modelling how shoppers process and respond to specific listing elements – keyword placement, benefit framing, visual hierarchy, and competitive differentiation. This produces a prediction of relative performance that correlates with live A/B test outcomes at approximately 90% accuracy for binary comparisons (which variant wins).
For sellers on e-commerce platforms beyond Amazon – including Walmart, eBay, and Etsy – AI prediction is often the only option for structured listing testing, since those platforms lack native A/B testing tools entirely.
PickFu and Panel Testing
PickFu provides rapid consumer panel feedback on listing elements. You show two or more variants to a panel of respondents who vote on preference and explain their reasoning. Results arrive within hours rather than weeks.
Strengths: Speed (results in 1-24 hours), qualitative feedback (respondents explain why they prefer each variant), ability to test before listing goes live, and no risk to existing traffic.
Limitations: Panel respondents are not real Amazon shoppers in a buying context. They are evaluating in isolation rather than comparing against competing listings in search results. The stated preference often diverges from actual purchase behaviour, particularly for impulse-driven categories. Cost per response is also significant when running multiple tests across many SKUs.
Manual Split Testing (Sequential)
Before Manage Your Experiments existed, sellers tested by changing listing content and monitoring conversion rates over time. This approach – running Version A for two weeks, then switching to Version B for two weeks – still works but has significant limitations.
The problem is confounding variables. Traffic quality, competitive landscape, seasonality, and advertising spend all change between periods. A conversion rate increase after a title change might be caused by the title, or by a competitor going out of stock, or by your PPC manager increasing bids. You cannot isolate the variable without simultaneous randomised exposure, which is exactly what Manage Your Experiments provides.
External A/B Testing Tools
Tools like Splitly and CashCowPro previously offered external A/B testing for Amazon listings. Most have been discontinued or face reliability issues because they require programmatic listing changes through Amazon’s API, which Amazon has increasingly restricted for content modification endpoints.
For current sellers, Manage Your Experiments is the only reliable method for true randomised split testing on Amazon’s platform. External tools should be considered supplementary rather than primary testing methods.
When AI Prediction Beats Live Testing
Live A/B testing remains the gold standard for certainty. But certainty comes with costs – time, risk, and opportunity cost. There are specific scenarios where predictive AI produces better outcomes than traditional split testing.
New Product Launches
You cannot A/B test a listing that does not exist yet. New products have no traffic history, no session baseline, and no established conversion rate. But launch is precisely when listing optimisation matters most – you get one shot at early momentum, and a poorly optimised listing burns through your launch budget while building negative velocity signals.
AI prediction lets you test five title variations, three image approaches, and multiple bullet point structures before your listing goes live. You launch with the highest-probability winner rather than guessing and hoping to optimise later once you have enough traffic to qualify for experiments.
Low-Traffic ASINs
Products with under 100 weekly sessions cannot qualify for Manage Your Experiments. But these are often the products that need listing optimisation most – they are not converting because their content is not compelling enough to drive organic traffic growth. It is a catch-22: you cannot test because you do not have traffic, and you do not have traffic because your listing is not optimised.
Predictive testing has no traffic minimum. A product getting 10 sessions per day can still receive AI-powered recommendations for title structure, bullet point priority, and image strategy.
Multi-Element Optimisation
If you need to optimise your title, bullets, AND A+ content, sequential A/B testing means 24+ weeks of experiments (8 weeks per element, three tests in sequence). AI prediction evaluates all elements simultaneously and delivers a complete optimisation plan in a single session.
This is particularly relevant for seasonal products where you have a narrow window to optimise before peak demand arrives. Waiting 6 months for sequential tests means missing an entire selling season.
Risk-Averse Scenarios
For top-selling ASINs (your best performers generating significant daily revenue), the risk of exposing 50% of traffic to a potentially worse variant is substantial. A product generating $500+ per day in profit stands to lose thousands during an underperforming test.
AI prediction carries zero traffic risk. You evaluate variations in a modelling environment, implement only changes with high predicted improvement, and preserve your current performance floor throughout the process.
Speed-Critical Decisions
Competitive response, seasonal preparation, and inventory-driven timeline pressure all create situations where waiting 8 weeks for a test result is commercially untenable. If a competitor launches a product targeting your keywords next week, you need listing improvements implemented immediately – not a test that concludes in October.
Portfolio-Wide Optimisation
Sellers with 50+ ASINs face a practical impossibility with live testing: optimising every listing through sequential A/B tests would take years. AI prediction scales horizontally – you can evaluate and optimise your entire catalogue in days rather than years, then use live testing selectively to validate the highest-impact changes on your top-revenue products.
Common A/B Testing Mistakes to Avoid
After analysing hundreds of Amazon A/B tests across multiple categories, these are the mistakes that consistently lead to wasted time, lost revenue, or incorrect conclusions.
Testing Too Many Variables Simultaneously
If your variant changes keyword order, adds a benefit claim, removes your brand name, and changes the separator style, you will never know which change caused the result. Even if your variant wins decisively, you cannot extract actionable learning because the improvement could be driven by any one of four changes – or a combination.
Discipline means changing one variable per test. Yes, this means more tests. Yes, this means more time. But each test produces genuine learning that compounds across your entire catalogue.
Running Tests During Advertising Changes
If you launch a Sponsored Products campaign, change bids, or pause advertising mid-test, you contaminate the data. Different traffic sources convert at different rates. PPC traffic is often higher-intent than organic traffic, so increasing PPC mid-test inflates conversion for both variants but may disproportionately benefit one over the other.
Keep your advertising strategy stable throughout the test period. If advertising changes are unavoidable, note them and consider extending the test to accumulate clean data after the change settles.
Ignoring Mobile Truncation
Over 60% of Amazon shopping now happens on mobile devices, where titles truncate at approximately 60-80 characters and only two bullet points display without scrolling. Testing a title variant where the meaningful change occurs after character 100 means most of your audience never sees the difference. Always ensure your test variations are visible within mobile display constraints.
Not Documenting Hypotheses and Learnings
Each test should have a recorded hypothesis (what you expect and why) and a documented outcome (what happened and what you learned). Without this discipline, you end up running the same types of tests repeatedly without building institutional knowledge about what works for your brand, category, and customer base.
Same product. Better listing. More sales.
Frequently Asked Questions
How long does an Amazon A/B test take?
Most Amazon A/B tests through Manage Your Experiments take 4-10 weeks to reach statistical significance. Title tests typically conclude faster (4-6 weeks) than A+ Content tests (8-10 weeks). The exact duration depends on your traffic volume and the magnitude of the performance difference between variants. Higher-traffic products reach significance faster because they accumulate more data points per week. Products getting 500+ daily sessions can sometimes reach significance in 3-4 weeks, while lower-traffic products may need the full 10-week recommended duration.
Can I run multiple A/B tests on the same product simultaneously?
No. Amazon limits you to one active experiment per ASIN at any time. This is intentional – running multiple tests simultaneously would confound results, making it impossible to attribute changes to specific variations. If you need to test titles, bullets, and A+ content, you must run them sequentially (typically 12-30 weeks total). This sequential constraint is one of the strongest arguments for using AI prediction to evaluate multiple elements simultaneously, then validating only the highest-impact change through a live test.
What happens to my BSR during an A/B test?
If your test variant performs worse than your control, your overall conversion rate drops, leading to fewer sales and BSR decline. Amazon’s algorithm does not account for the fact that you are running an experiment. The BSR impact is real and immediate. For high-ranking products in competitive categories, this is a meaningful risk to consider before testing – the recovery period after the test can extend weeks beyond the experiment conclusion.
Do I need Brand Registry for A/B testing?
Yes. Amazon Brand Registry enrollment is a hard requirement for Manage Your Experiments. You need an active registered trademark in the marketplace where you want to test. Sellers without Brand Registry cannot access this tool and must rely on alternative testing approaches like AI prediction, PickFu panel testing, or manual sequential testing with conversion rate monitoring.
What is the minimum traffic needed for Amazon A/B testing?
Amazon does not publish an exact threshold, but sellers consistently report needing approximately 100-200 sessions per week for an ASIN to qualify. Products below this threshold will see the experiment creation option greyed out or receive an eligibility error. In practical terms, you need an established product with regular organic or advertising-driven traffic. If your product is close to the threshold, consider a moderate PPC push for 2-3 weeks to establish the required baseline before initiating the experiment.
Can I end an A/B test early if one variant is clearly winning?
You can technically end a test early, but Amazon strongly advises against it. Early results are unreliable – statistical significance requires sufficient sample size regardless of how dramatic early differences appear. Ending a test at 70% confidence means there is a 30% chance you are implementing the wrong variant. The recommended approach is to let tests run their full recommended duration unless you observe a catastrophic conversion decline (greater than 50% drop) that threatens your product viability. In that extreme case, ending early to protect revenue is justified.
How accurate is AI prediction compared to live A/B testing?
AI prediction models achieve approximately 90% accuracy on binary comparisons (predicting which of two variants will win). This compares to roughly 100% accuracy from live A/B tests that reach 95%+ statistical significance – but with the critical trade-off that AI prediction delivers results instantly while live tests take 8+ weeks. For most listing optimisation decisions, the speed advantage of AI prediction outweighs the marginal accuracy difference, particularly when the alternative is not testing at all due to time or traffic constraints.
Should I A/B test during Prime Day or holiday periods?
Avoid starting or running A/B tests during major shopping events (Prime Day, Black Friday, Cyber Monday, Christmas). Traffic during these periods behaves fundamentally differently – shoppers are more deal-motivated, less brand-loyal, and convert at different rates than normal. Results from event periods do not generalise to regular trading conditions. Pause or avoid scheduling tests that would overlap with major promotional events. If you need to optimise before a major event, use AI prediction to implement changes beforehand rather than running live tests during the event itself.
What is the best first A/B test for a new Amazon seller?
Start with a title test. Product titles have the broadest impact (affecting both search click-through rate and listing conversion rate), require the least effort to create variations (you are rearranging existing keywords rather than creating new visual assets), and typically reach significance fastest due to their high-visibility position. Test your current title against a version that leads with your primary benefit keyword rather than your brand name – this is the single highest-probability improvement for most Amazon listings.
About the Author
Andrew Mac is the founder of Saucery, where he builds AI-powered listing prediction tools for e-commerce brands. Before Saucery, he spent 15 years in product commercialisation, helping brands validate product decisions before market launch. He writes about the intersection of AI, consumer behaviour, and e-commerce optimisation.
Subscribe for F&B Consumer Insights
Data-driven insights on food & beverage consumer preferences, straight to your inbox.