Part of our Complete Guide to Product Pricing Strategy
By Andrew Mac, Founder of Saucery — The gabor-granger pricing method answers the question Van Westendorp can’t: how many people will actually buy at each price point? I’ve used it to build demand curves for product teams across CPG, DTC, and SaaS. It’s the fastest path from “we think we should charge X” to “here’s the data showing X maximises revenue.”
Pricing is never just about finding the “right” number. It’s about understanding the relationship between price and demand. Charge more and fewer people buy, but each sale is worth more. Charge less and volume increases, but margin shrinks. Somewhere in that trade-off sits your revenue-maximising price — and the gabor-granger pricing method is designed to find it.
Developed by economists Andre Gabor and Clive Granger in the 1960s, this methodology uses a simple sequential structure to map purchase probability across a range of prices. The output is a demand curve specific to your product, your audience, and your competitive context. From that curve, you can calculate the price that maximises revenue, the price that maximises volume, and the elasticity between them.
This guide covers how the gabor-granger pricing method works, how to interpret the output, when to use it instead of (or alongside) Van Westendorp, and how modern AI-powered approaches are making it accessible without traditional panel recruitment.
Table of Contents
- What Is the Gabor-Granger Pricing Method?
- How the Gabor-Granger Pricing Method Works
- Interpreting Your Demand Curve
- Finding the Revenue-Maximising Price
- Gabor-Granger vs Van Westendorp: When to Use Each
- Gabor-Granger vs Conjoint Analysis
- Designing a Gabor-Granger Study: Price Points and Structure
- Sample Size and Statistical Confidence
- Real-World Applications Across Categories
- Running Gabor-Granger With AI-Modelled Shoppers
- Common Mistakes and How to Avoid Them
- How to Run Your First Gabor-Granger Study
- Frequently Asked Questions
What Is the Gabor-Granger Pricing Method?
The gabor-granger pricing method is a direct pricing research technique that measures purchase intent at multiple price points to construct a demand curve. Unlike Van Westendorp, which identifies an acceptable price range, Gabor-Granger tells you what percentage of your target audience would buy at each specific price. This makes it directly actionable for revenue forecasting and price optimisation.
The core mechanic is simple: show a respondent your product concept, ask “would you buy this at $X?”, then adjust the price up or down based on their answer. Repeat across your full price range. Aggregate across 200-300 respondents and you have a statistically reliable demand curve.
The methodology sits between simple willingness-to-pay questions (which produce a single number with no context) and full conjoint analysis (which accounts for competitive dynamics but costs 5-10x more). For most product teams making a pricing decision on a defined concept, the gabor-granger pricing method hits the sweet spot of actionability and cost.
How the Gabor-Granger Pricing Method Works
The gabor-granger pricing method uses a sequential monadic design. Each respondent sees your product at one price, states their purchase intent, then sees it at a higher or lower price. There are two common implementations:
The Classic Sequential Approach
Start with a mid-range price. If the respondent says yes (would buy), increase the price. If no, decrease. Continue until you find their threshold. This is efficient per respondent but can introduce order effects.
- Present product concept with full description
- Ask: “Would you buy this product at $5.99?” (start at midpoint)
- If YES: “Would you buy at $6.99?”
- If NO: “Would you buy at $4.99?”
- Continue until all price points tested or threshold found
The Extended (Multi-Point) Approach
Show each respondent all price points in randomised order. This eliminates order effects but requires more questions per respondent. For each price, ask purchase intent on a 5-point scale (definitely would buy, probably would buy, might or might not, probably would not, definitely would not).
The extended approach is more common in modern implementations because it produces richer data per respondent and avoids the anchoring that sequential presentation creates. It’s also better suited to AI-modelled respondents where question fatigue isn’t a concern.
Choosing Your Price Points
Select 4-7 price points spanning your realistic range. Best practice:
- Include your current/expected price as the midpoint
- Include at least 2 points above and 2 below
- Space them at psychologically meaningful intervals (not $5.00, $5.10, $5.20 — instead $4.49, $4.99, $5.49, $5.99, $6.49)
- Use real retail price points that exist in your category (ending in .99, .49, or round numbers depending on category norms)
- If you’ve already run a Van Westendorp study, use the PMC-PME range to set your boundaries
Interpreting Your Gabor-Granger Demand Curve
The output of the gabor-granger pricing method is a demand curve: a chart showing purchase probability (Y axis) against price (X axis). The curve always slopes downward — higher prices mean lower purchase intent — but the shape tells you everything about your pricing power.
Reading the Curve Shape
Steep curve (elastic demand): Small price changes produce large shifts in purchase intent. Your product is price-sensitive. Common in commoditised categories where alternatives are readily available. Price carefully — every dollar above optimal costs disproportionate volume.
Flat curve (inelastic demand): Price changes have minimal impact on purchase intent. Your product has pricing power, likely driven by unique features, strong brand, or lack of substitutes. You have room to price higher without significant volume loss.
Kinked curve: Relatively flat until a specific price point, then drops sharply. This reveals a psychological threshold — often a round number or category price ceiling. Extremely valuable to identify because pricing just below the kink maximises revenue.
Converting Intent to Expected Purchase Rate
Raw purchase intent from surveys always overstates actual purchase behaviour. Industry benchmarks suggest applying these conversion factors:
- “Definitely would buy” — 70-80% actual conversion
- “Probably would buy” — 30-40% actual conversion
- “Might or might not” — 10-15% actual conversion
- “Probably/Definitely would not” — 0-5% actual conversion
These calibration factors vary by category. FMCG (low-risk, frequent purchase) converts higher. Durables and high-ticket items convert lower. Apply category-appropriate factors before using Gabor-Granger results for volume forecasting.
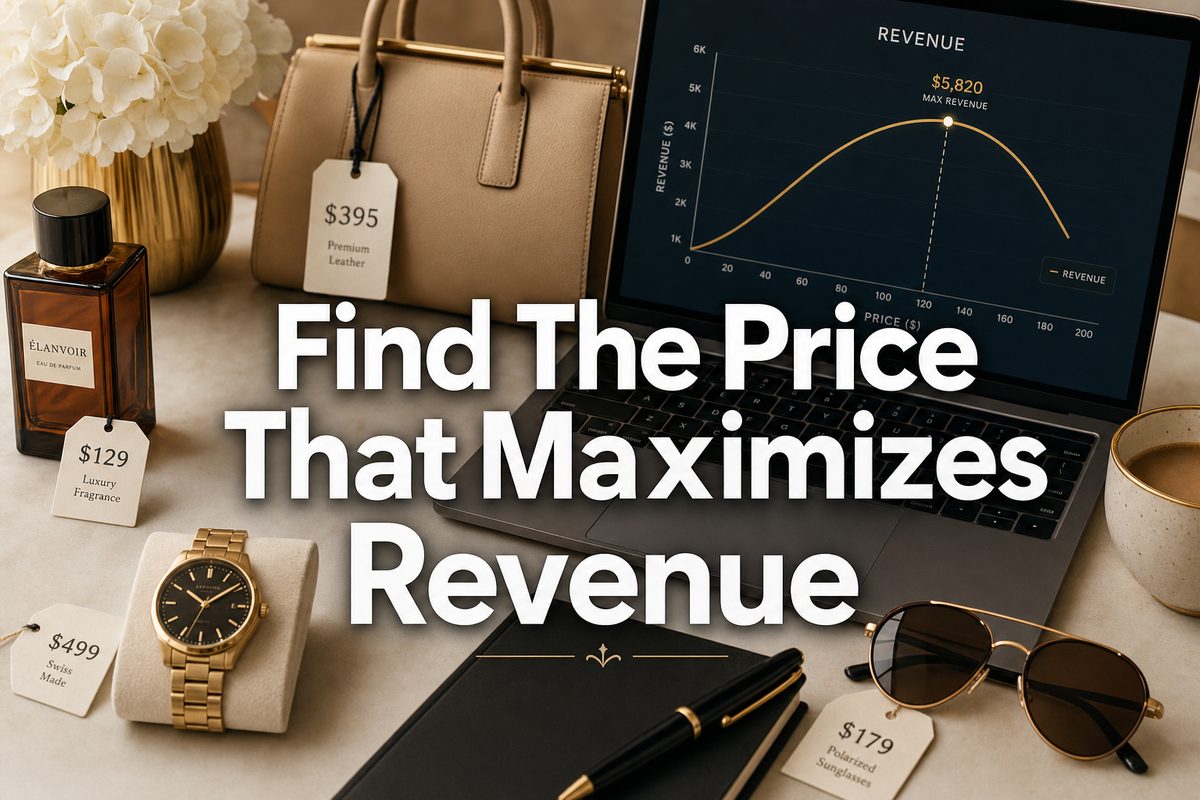
Finding the Revenue-Maximising Price
This is where the gabor-granger pricing method delivers its primary value. For each price point, multiply price by purchase probability to get expected revenue per potential customer:
Revenue Index = Price x Purchase Probability
| Price | Purchase Probability | Revenue Index |
|---|---|---|
| $3.99 | 78% | 3.11 |
| $4.49 | 71% | 3.19 |
| $4.99 | 62% | 3.09 |
| $5.49 | 48% | 2.64 |
| $5.99 | 35% | 2.10 |
In this example, $4.49 maximises the revenue index despite not having the highest purchase probability or the highest price. This is the insight Gabor-Granger provides that Van Westendorp cannot: the precise point where the trade-off between price and volume is optimised.
Revenue vs Volume vs Margin Optimisation
The revenue-maximising price isn’t always the right choice. Consider:
- Volume-maximising: Choose the lowest price with acceptable margin. Best for new product launches where trial and distribution velocity matter more than per-unit revenue.
- Revenue-maximising: The Gabor-Granger sweet spot (price x probability). Best for established products optimising an existing price.
- Margin-maximising: Factor in COGS. Revenue index becomes (Price – COGS) x Purchase Probability. Often produces a higher recommended price than pure revenue optimisation because it accounts for the cost base.
Gabor-Granger Pricing Method vs Van Westendorp
These are complementary methodologies, not competitors. The Van Westendorp pricing model tells you the acceptable price corridor. The gabor-granger pricing method tells you exactly where within that corridor to price for maximum revenue.
| Dimension | Gabor-Granger | Van Westendorp |
|---|---|---|
| Primary output | Demand curve + revenue-maximising price | Acceptable price range (4 intersection points) |
| Answers the question | “How many will buy at each price?” | “What price range is acceptable?” |
| Demand estimation | Yes | No |
| Revenue forecasting | Yes (with calibration) | No |
| Price range discovery | Limited (you must pre-define the range) | Yes (respondents define it) |
| Quality floor detection | No | Yes (“too cheap” question) |
| Best at | Optimising within a known range | Discovering the range in the first place |
The ideal workflow: Run Van Westendorp first to discover the acceptable corridor, then run the gabor-granger pricing method within that corridor to find the optimal price point. This two-stage approach gives you both the boundaries and the optimum. With AI-modelled shoppers, both studies can be run in under 30 minutes total for under $100 combined.
Run Van Westendorp + Gabor-Granger in one session. Saucery delivers both methodologies with AI-modelled shoppers — find your price corridor and revenue-maximising point in under 30 minutes. Get started here.
Gabor-Granger Pricing Method vs Conjoint Analysis
Choice-based conjoint is more powerful but significantly more complex and expensive. The key differences:
Conjoint adds competitive context. In the gabor-granger pricing method, respondents evaluate your product in isolation. In conjoint, they choose between your product and competitors at various prices. This means conjoint captures switching behaviour and competitive vulnerability that Gabor-Granger misses.
Conjoint handles feature trade-offs. If you’re deciding between “premium ingredients at $5.99” and “standard ingredients at $4.49,” conjoint can isolate the value of each feature. The gabor-granger pricing method tests one fixed product at multiple prices.
When Gabor-Granger is enough: Your product concept is fixed, you know your competitive set but aren’t trying to model switching, and you need a pricing decision rather than a full market simulation. For 80% of growth-stage pricing decisions, this is sufficient.
When you need conjoint: You’re simultaneously optimising price AND features, you need to model competitive response scenarios, or the pricing decision has more than $1M annual revenue impact and justifies the additional investment. Discrete choice experiments offer a middle ground between the gabor-granger pricing method and full hierarchical Bayesian conjoint.
Designing a Gabor-Granger Study
The gabor-granger pricing method is straightforward to design, but small choices in study structure significantly impact the quality of your demand curve.
Selecting Price Points
Choose 5-7 price points. Fewer than 4 produces a curve with too few data points. More than 8 creates respondent fatigue (in traditional panels) or unnecessary cost without improving precision.
Spacing rules:
- Use psychologically real prices (e.g., $4.99, not $5.03)
- Space at consistent intervals (e.g., $0.50 or $1.00 increments)
- Span from “clearly too cheap for the category” to “clearly too expensive”
- If you’ve run Van Westendorp first, use PMC to PME as your boundaries
- Include your hypothesised/current price as one of the points
Product Description Requirements
The product concept must be complete and unambiguous. Include:
- Product name and brand
- Physical format and size (“330ml can”, “12-pack box”, “monthly subscription”)
- Key ingredients or features
- Primary benefit claim
- Where it would be sold (channel context affects price expectations)
Respondents price what they can visualise. A vague description produces noisy data. The more specific the concept, the tighter the confidence intervals on your demand curve.
Purchase Intent Scale
The standard 5-point scale for the gabor-granger pricing method:
- Definitely would buy
- Probably would buy
- Might or might not buy
- Probably would not buy
- Definitely would not buy
For demand curve construction, typically count “definitely” + “probably” as the purchase probability (top-2 box). Some analysts use a weighted approach: definitely = 1.0, probably = 0.5, might = 0.1, others = 0. The weighted approach produces a more conservative (and often more accurate) demand curve.
Sample Size and Statistical Confidence
For the gabor-granger pricing method, 200-300 respondents produces a demand curve with confidence intervals narrow enough for most pricing decisions. At n=250, you can typically distinguish between price points that are $0.50 apart in their purchase probability.
If you need to segment (e.g., separate demand curves for heavy buyers vs light buyers, or by age cohort), you need 150+ per segment. A study with two segments requires n=300-400 total.
Below n=100, the confidence intervals are too wide to distinguish between adjacent price points, making the study directional only. At n=500+, you get precision that rarely changes the decision — diminishing returns set in quickly above 300.
Real-World Applications of the Gabor-Granger Pricing Method
New SKU Launch Pricing
A functional beverage brand launching a new adaptogen sparkling water needs to decide between $3.49 and $4.49 per can. The gabor-granger pricing method reveals that purchase intent at $3.99 is 58% vs 61% at $3.49 — only a 3-point drop for a $0.50 premium. Revenue index favours $3.99. The brand launches at $3.99 with confidence that they’re not sacrificing meaningful volume for the extra margin.
Price Increase Justification
A protein bar brand considering a price increase from $2.99 to $3.49 due to ingredient cost inflation. The gabor-granger pricing method shows purchase intent drops from 65% to 57% — an 8-point decline. Revenue index: $2.99 x 65% = 1.94 vs $3.49 x 57% = 1.99. The data supports the increase: despite lower volume, revenue per potential customer improves. Critically, it also shows $3.99 would be a step too far (intent drops to 38%).
Subscription Tier Optimisation
A supplement brand running DTC subscriptions at $39.99/month wants to know if they’re leaving money on the table. The gabor-granger pricing method tests intent at $34.99, $39.99, $44.99, $49.99, and $54.99. Results show a kink at $49.99 — intent is relatively stable from $39.99 to $44.99 (dropping only 4 points) but falls sharply at $49.99 (dropping 18 points). The brand increases to $44.99, capturing the inelastic segment of their demand curve.
SaaS Per-Seat Pricing
The gabor-granger pricing method isn’t limited to physical products. A B2B SaaS tool testing $15, $25, $35, $49, and $69 per seat per month can use the same methodology to identify where the demand curve kinks and which price maximises expected revenue per prospect.
Running the Gabor-Granger Pricing Method With AI-Modelled Shoppers
Traditional Gabor-Granger studies require recruiting 200-300 qualified respondents through a panel provider. This means:
- 2-6 weeks total timeline (briefing, programming, fieldwork, analysis)
- $5,000-$25,000+ cost depending on audience specificity and panel provider
- Significant upfront commitment before seeing any data
AI-modelled shoppers fundamentally change this equation. Instead of recruiting real respondents, you simulate purchase decisions using AI models calibrated to census-level demographic data. Each modelled shopper responds according to the established price sensitivities of their demographic profile.
The practical benefits for the gabor-granger pricing method specifically:
- Instant iteration: Test $3.99-$5.99 range first, see the curve, then zoom in on $4.29-$4.99 for precision. With real panels, each iteration costs thousands and takes weeks. With AI shoppers, it takes minutes.
- A/B test your product description: Does “cold-pressed organic juice” command a higher demand curve than “premium juice blend”? Run both in 10 minutes and compare curves.
- No anchoring contamination: AI-modelled respondents don’t carry anchoring effects between questions the way fatigued panel respondents do.
- Cost-effective segmentation: Want separate demand curves for millennials vs Gen X? With traditional panels, that doubles your recruitment cost. With AI shoppers, it’s the same cost.
At Saucery, we run the gabor-granger pricing method using discrete choice experiments with AI-modelled shoppers calibrated to census demographics across 7 markets. The demand curve output is equivalent in structure to traditional panel-sourced data, with the rank ordering of price preferences holding consistent between methods.
Common Mistakes in Gabor-Granger Studies
1. Testing Too Few Price Points
Three price points give you a line, not a curve. You can’t identify kinks, thresholds, or the revenue-maximising point with confidence. Minimum four, ideally five to seven.
2. Unrealistic Price Range
Testing $1.99 to $9.99 for a product that clearly belongs in the $3-5 range wastes data points on prices nobody would seriously consider. Tighter ranges with more points produce more useful curves. Use Van Westendorp first if you’re unsure of the boundaries.
3. Ignoring Non-Linear Demand
Don’t assume demand declines linearly with price. In practice, most demand curves have kinks at psychological thresholds. If your price points are too widely spaced, you’ll miss the kink and the model will smooth over the most important pricing insight.
4. Not Calibrating Intent to Behaviour
The biggest error in applying gabor-granger pricing method results is treating stated intent as actual purchase rate. If 60% say “definitely/probably would buy” at $4.99, your actual conversion rate will be 25-40%, not 60%. Always apply category-appropriate calibration factors before revenue forecasting.
5. Testing Price Alongside Other Variables
The gabor-granger pricing method requires a fixed product concept. If you change the product description between price points (different claims, different sizes, different packaging), you’re no longer measuring price sensitivity — you’re confounding price with product attributes. Test price in isolation. Test other variables in a separate concept testing study.
How to Run Your First Gabor-Granger Study
- Define your product concept. Complete description: brand, product type, size, key features, primary benefit, channel context.
- Set your price range. Ideally informed by Van Westendorp or competitive analysis. Include 5-7 points at realistic retail intervals.
- Choose your audience. Category buyers only. Define demographics and purchase behaviours. Match to your target market.
- Select your method. Traditional panel ($5K-25K, 2-6 weeks), DIY survey + panel ($2-5K, 1-2 weeks), or AI-modelled shoppers (under $100, minutes).
- Run the study. Present concept, test intent at each price point. Randomise price order in multi-point designs.
- Build the demand curve. Plot purchase probability (top-2 box or weighted) against each price point.
- Calculate revenue index. Price multiplied by probability at each point. Identify the maximum.
- Apply calibration. Adjust for stated intent vs actual behaviour (category-specific factors).
- Decide. Revenue-maximising, volume-maximising, or margin-maximising — pick based on your business objective.
Found your optimal price? Now test it in context.
Price sensitivity is only half the picture. See how AI shoppers respond to your complete listing – price, claims, and copy together – before you go live.
Optimise your listingFrequently Asked Questions About the Gabor-Granger Pricing Method
How many price points should I test?
Five to seven is optimal for the gabor-granger pricing method. Fewer than four doesn’t produce a reliable curve. More than eight creates diminishing returns and respondent fatigue in traditional panels. With AI-modelled shoppers, you can test more points without quality degradation, but the analytical insight rarely improves beyond seven well-chosen points.
Can I use the gabor-granger pricing method for services?
Yes. The methodology works for any offering where consumers have a purchase/no-purchase decision at a given price. SaaS subscriptions, consulting packages, membership tiers, and service bundles are all suitable. The key requirement is that the offering is clearly enough defined for respondents to evaluate.
Should I run Gabor-Granger or Van Westendorp first?
Van Westendorp first, then the gabor-granger pricing method second. Van Westendorp discovers the acceptable range (you don’t need to pre-define prices). Gabor-Granger then optimises within that range. If you already know your approximate range from competitive analysis, you can skip straight to Gabor-Granger.
What’s the minimum sample size?
200 respondents minimum for the gabor-granger pricing method to produce a single-segment demand curve. 300+ if you want to cut by demographics or behaviour. Below 100, the confidence intervals are too wide for meaningful price optimisation.
How accurate is the gabor-granger pricing method with AI respondents?
The rank ordering of prices (which price produces highest intent, second highest, etc.) is consistent between AI-modelled and panel-sourced respondents. Absolute purchase probability percentages may differ by 5-10 points, but the shape of the demand curve and the location of the revenue-maximising price hold stable. For directional pricing decisions, this accuracy is sufficient.
Does the gabor-granger pricing method account for competitor prices?
No. Like Van Westendorp, the gabor-granger pricing method evaluates your product in isolation. Respondents aren’t choosing between your product and alternatives — they’re simply stating whether they’d buy yours at each price. For competitive context, you need conjoint analysis or discrete choice experiments that include competitor products as alternatives.
How is this different from a simple “how much would you pay” question?
A single WTP question gives you one number with no context. The gabor-granger pricing method gives you a full demand curve — showing how purchase intent changes across your entire price range. This reveals elasticity, thresholds, and the revenue-maximising trade-off between price and volume. One number tells you nothing about how sensitive demand is to price changes; a curve tells you everything.
About the author: Andrew Mac is the founder of Saucery, a pre-launch testing platform that uses AI-modelled shoppers to deliver instant pricing research, concept testing, and claims validation. He works with product teams to validate pricing decisions before they commit to production. Connect with Andrew on LinkedIn.
Subscribe for F&B Consumer Insights
Data-driven insights on food & beverage consumer preferences, straight to your inbox.