I’ve spent the last six months building a tool that predicts how shoppers will react to a product listing before it goes live. Not a keyword tool. Not a readability checker. Something that simulates actual purchase decisions based on what’s written on the page.
Most sellers treat their listing copy as a set-and-forget task. Write the bullets, upload the images, move on. The problem is that by the time you find out your copy isn’t converting, you’ve already lost months of sales, burned through PPC budget driving traffic to a weak page, and watched your BSR slide while competitors with worse products outrank you.
This post shows exactly what happens when you run three real Amazon listings through our optimiser. I picked products from completely different categories: kids’ sports gear, wireless headphones, and a home office accessory. What they have in common is more interesting than what separates them.
What the tool actually does (30 seconds)
You paste your listing – title, bullets, description, price, category. Within minutes, you get:
- A listing score (0-100) measuring how likely shoppers are to buy based on your copy alone
- Predicted star rating – what reviews would probably say if 50 shoppers bought today
- Likely praise – the specific phrases shoppers would use to recommend you
- Likely complaints – the objections forming in a buyer’s head before they click away
- Expectation gaps – promises your listing makes that the product might not deliver on
- Platform-ready rewrites – improved titles, bullets, and descriptions you can paste straight into Seller Central
No survey. No waiting. No panel recruitment. AI-modelled shoppers calibrated to actual purchasing behaviour give you directional feedback in the time it takes to make a coffee.
Why these three products
I didn’t cherry-pick listings that look terrible. I picked three products that are actively selling, have strong review scores (4.4-4.6 stars), and represent different categories, price points, and markets. If the tool only found problems in obviously bad listings, it wouldn’t be useful. The question is: can it find hidden friction in listings that appear to be working fine?
The answer, across all three, was yes. And the type of friction was remarkably consistent.
Listing 1: Kids’ Soccer Shin Guards ($8.88, US market)
Category: Sports & Outdoors > Soccer > Shin Guards
BSR: #28 in Soccer Shin Guards
Current reviews: 4.5 stars
Price: $8.88
What the seller wrote
The title was 149 characters of keyword stuffing: “Soccer Shin Guards with Socks for Kids Youth, PP Shell & EVA Cushion Shin Pads, Shock Absorption Protective Soccer Equipment for 3-15 Years Boys Girls, Training & Matches”
Every bullet point opened with emoji brackets and repeated the same protection claims in slightly different words. The description was a wall of text restating the bullets.
What the tool found
Listing score: 72/100
Predicted rating: 4.8 stars
Confidence: Medium
The score was high – but not because of the copy quality. It was high because the product itself is genuinely good (PP shell, EVA cushion, included socks, adjustable straps). The listing was succeeding despite its copy, not because of it.
Likely praise (what shoppers would say):
- “Strong protection from the hard shell and padding”
- “Comfortable fit for kids during practices”
- “Nice that it comes with socks – feels like a complete set”
- “Velcro straps work well for growing kids”
Likely complaints (the problems hiding in plain sight):
- “Sizing is confusing – which size for my 7 year old?”
- “No idea how to wash the socks”
- “Can’t tell what colours are available”
- “How long will these last with twice-a-week training?”
The pattern: Every single complaint was about information that should be in the listing but isn’t. The product is fine. The copy is incomplete.
What this means in revenue terms
A parent searching “soccer shin guards kids” sees 20+ options. They click through 3-4. If your listing doesn’t immediately answer “what size for my kid?” they don’t add to cart – they go back to results and buy from the competitor who made it obvious. That’s not a lost click. That’s a lost customer who already found you.
The fix was straightforward: add a size chart reference in bullet 1, mention machine-washable socks, clarify colour options. Not a rewrite. A gap-fill that takes 10 minutes.
Listing 2: SHOKZ OpenFit Headphones ($199, AU market)
Category: Electronics > Headphones > Open-Ear
Current reviews: 4.4 stars (4,446 reviews)
Price: $199
What the seller wrote
SHOKZ is a sophisticated brand with professional copy. Their bullets cover every technical spec: Bluetooth 5.2, 28-hour battery, IP54 waterproof, dual noise-cancelling mics. The listing reads like it was written by a product team who knows their audience.
What the tool found
Listing score: 53/100
Predicted rating: 3.7 stars
Confidence: High
Wait – a 4.4-star product with a predicted 3.7? That gap is the insight.
Likely praise:
- “Feature coverage gives shoppers confidence in practical battery, open-ear, material details”
- “Tech-focused buyers like having dense specs and product benefits”
- “Open-ear safety benefit connects with outdoor/travel use”
Likely complaints:
- “Presentation is too wordy, repetitive, or cluttered”
- “Gift buyers and older shoppers feel the details are harder to process”
- “Practical use cases (workouts, gaming, commute) aren’t emphasised clearly enough”
- “Title and bullets feel overloaded, diluting the core benefits”
The pattern: Too much information, structured wrong. The listing was written for the product team, not the buyer. Technical specs are there, but the reason to choose this over AirPods is buried.
Why this matters more than you think
SHOKZ has 4,446 reviews and strong BSR. They don’t need this tool, right? But consider: if their listing is underperforming by even 5% on conversion rate due to cluttered copy, that’s potentially thousands of lost sales per month at their volume. For a smaller seller in the same category without the review moat, the same mistakes would be fatal.
The lesson for any seller: a complete listing isn’t necessarily a clear listing. Shoppers scan. If they can’t find their answer in 3 seconds, they leave.
Think about how you shop on Amazon yourself. You click through, scan the bullets looking for the one thing you care about (battery life? comfort for long use? works with my phone?), and if you can’t find it in the first pass, you click back. You don’t read all 5 bullets carefully. You don’t scroll to the description. You scan, decide, and either add to cart or bounce.
Your listing has to survive that scan. SHOKZ’s doesn’t – and they’re winning anyway because of brand strength and review volume. Most sellers don’t have that cushion.
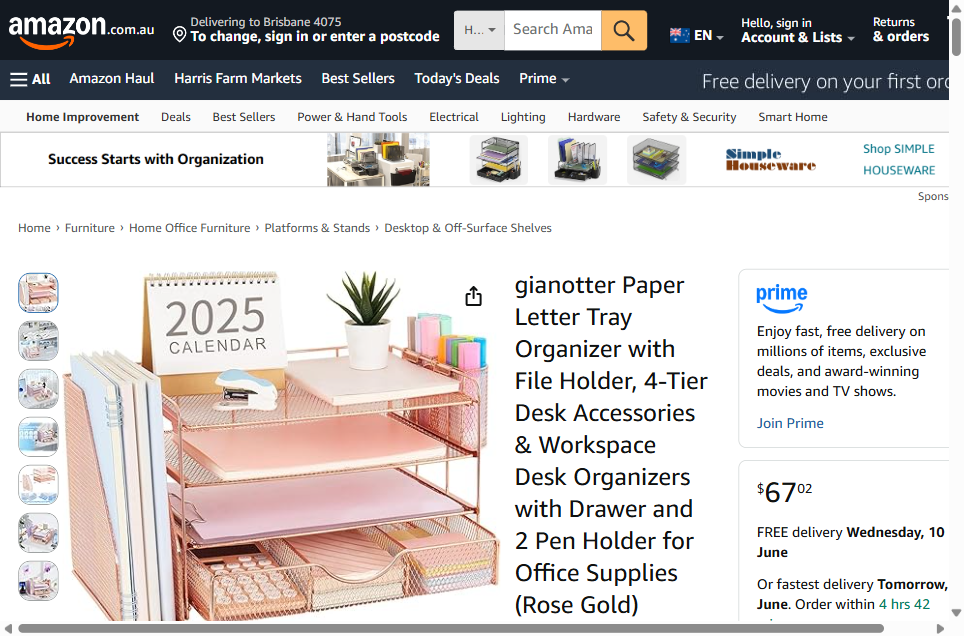
Listing 3: Rose Gold Desk Organiser ($67, AU market)
Category: Home > Furniture > Desktop & Off-Surface Shelves
Current reviews: 4.6 stars (4,374 reviews)
Price: $67.02
Brand: gianotter
What the seller wrote
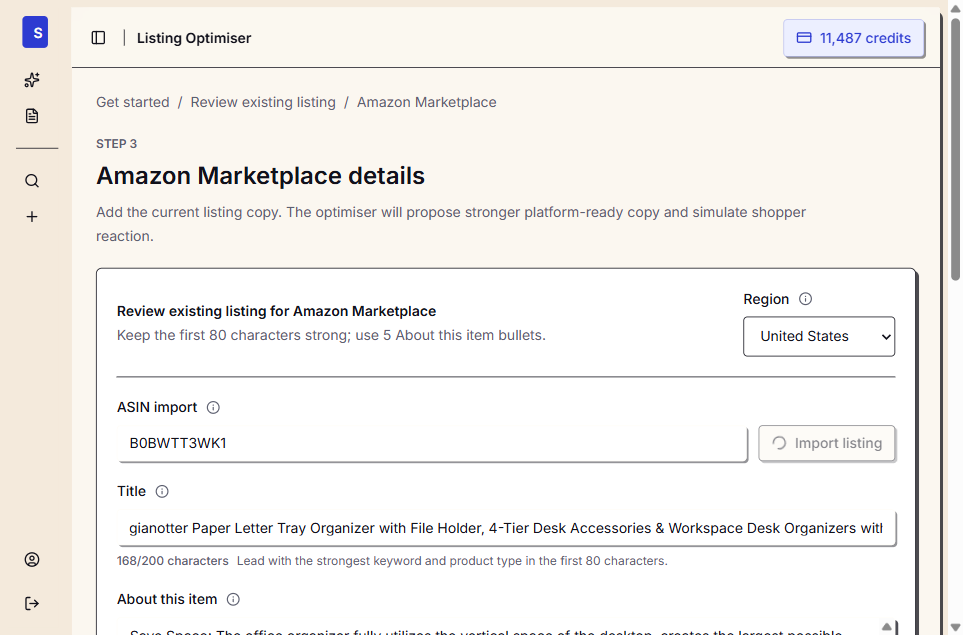
The title is a word salad: “gianotter Paper Letter Tray Organizer with File Holder, 4-Tier Desk Accessories & Workspace Desk Organizers with Drawer and 2 Pen Holder for Office Supplies (Rose Gold)”
The bullets use emoji folder icons and lead with generic benefit headers: “Save Space”, “Improve Work Efficiency”, “High Quality Material”, “Easy to Assemble”, “Happy Purchase.” The last bullet is entirely about their return policy – wasting prime selling space on information that belongs in the FAQ section.
What the tool found
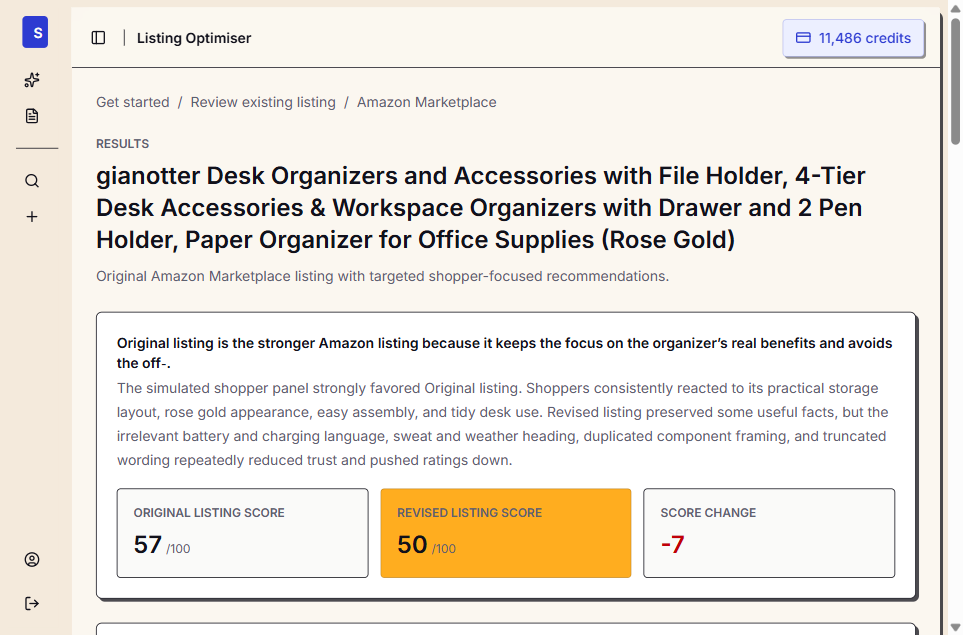
Original listing score: 57/100
Predicted rating: 3.1 stars (revised version)
Confidence: High
Here’s where it gets interesting. The tool tried to generate a stronger version and scored it lower than the original (50 vs 57). The AI rewrite accidentally introduced irrelevant content – “battery and charging” callouts and “sweat and weather ready” language that has nothing to do with a desk organiser.
The tool caught its own mistake: “Original listing is the stronger Amazon listing because it keeps the focus on the organizer’s real benefits and avoids the irrelevant content.”
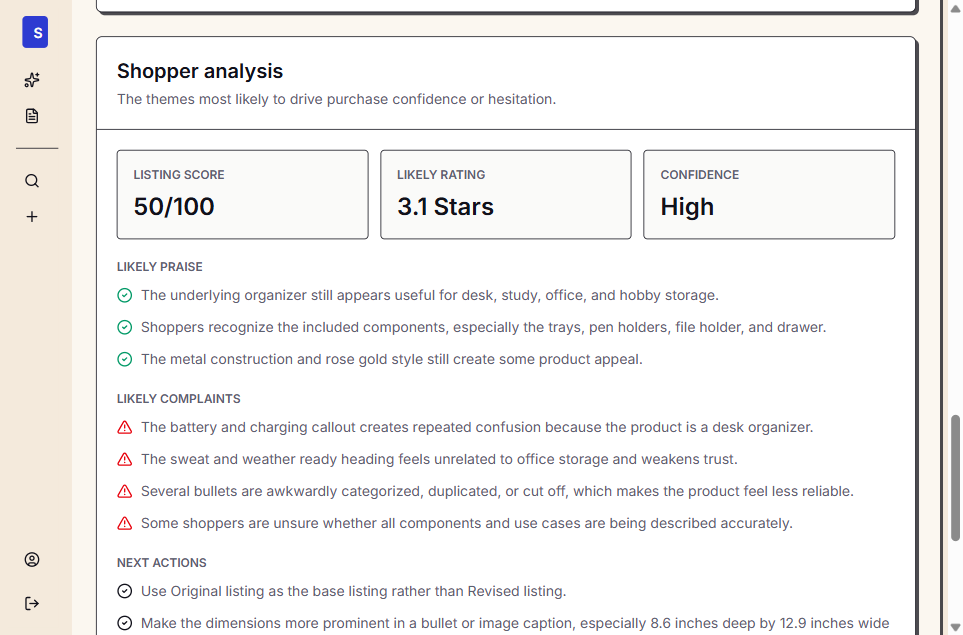
Likely praise:
- “The underlying organizer still appears useful for desk, study, office, and hobby storage”
- “Shoppers recognize the included components, especially the trays, pen holders, file holder, and drawer”
- “The metal construction and rose gold style still create some product appeal”
Likely complaints:
- “Several bullets are awkwardly categorized, duplicated, or cut off, which makes the product feel less reliable”
- “Some shoppers are unsure whether all components and use cases are being described accurately”
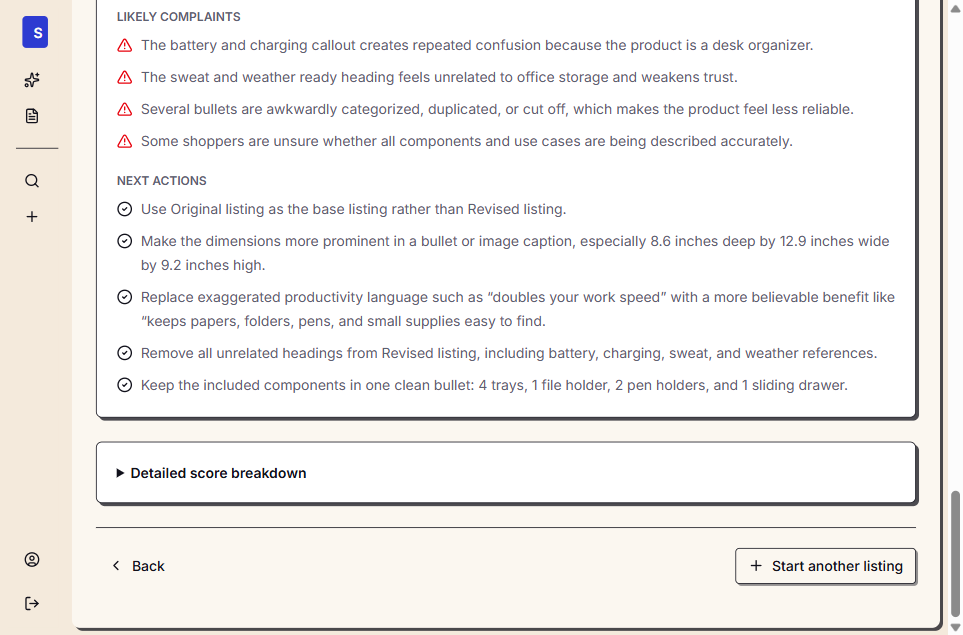
Recommended next actions:
- Make the dimensions more prominent (8.6 x 12.9 x 9.2 inches)
- Replace “doubles your work speed” with a more believable benefit like “keeps papers, folders, pens, and small supplies easy to find”
- Keep the included components in one clean bullet: 4 trays, 1 file holder, 2 pen holders, and 1 sliding drawer
The pattern: The listing’s biggest weakness isn’t what it says – it’s how it says it. Exaggerated claims (“doubles your work speed”) and a wasted bullet on return policy create a gap between what the listing promises and what a shopper expects from a $67 desk accessory. And the generic emoji headers add visual noise without adding information.
Why this matters more than the 4.6-star rating suggests
This product has 4,374 reviews at 4.6 stars. It sells. But at a 57/100 listing score, it’s leaving conversion rate on the table. The fixes are small – add dimensions, drop the exaggerated claims, replace the return policy bullet with an actual benefit – but each one removes a micro-hesitation that costs a percentage point of conversion.
The mistake all three had in common
It wasn’t bad writing. None of these were poorly written listings. The mistake was the same in every case:
They answered the question “what is this product?” instead of “why should I buy this instead of the other one?”
Every listing described features. None of them addressed the specific moment where a shopper is comparing two similar options and needs a reason to choose. That moment – the 3 seconds between “this looks decent” and clicking “Add to Cart” – is where listing copy either converts or doesn’t.
The shin guards listed PP shell, EVA foam, Velcro straps. They didn’t say “fits your kid on day one without adjusting, and still fits next season.” The headphones listed Bluetooth 5.2, 28-hour battery, IP54. They didn’t say “the only headphone you can wear all day without ear fatigue.” The desk organiser listed “Save Space” and “Improve Work Efficiency” without once describing what it actually looks like assembled on a real desk.
This is what a unique selling proposition looks like in practice. It’s not a tagline you brainstorm in a meeting. It’s the specific reason a shopper picks you over the other option they had open in another tab 3 seconds ago. And your listing copy is where that reason either shows up or doesn’t.
Why features fail on Amazon
A feature is a fact about your product. “Made from durable metal mesh.” A benefit is what that fact means for the buyer. “Stays sturdy on your desk for years without sagging under heavy files.”
But on Amazon, even benefits aren’t enough. What works is what I call a purchase confidence signal – a statement that removes a specific doubt the shopper has at the moment of decision.
The shin guards shopper’s doubt: “Will these fit my kid?” The headphones shopper’s doubt: “Will these hurt my ears after 3 hours?” The desk organiser shopper’s doubt: “Will this actually fit on my desk?”
None of the three listings addressed their shopper’s primary doubt. All three listed features instead. And all three were leaving conversion rate on the table as a result.
Features describe. Benefits connect. Confidence signals convert. Every seller knows the first. Most know the second. Almost none execute the third.
Why sellers don’t fix this (and what it actually costs)
I talk to Amazon sellers every week. When I show them their listing score, the reaction is usually some version of: “Yeah, I know my bullets could be better, but…”
“I’ll get to it eventually”
Listing copy sits at the bottom of the priority list because it doesn’t feel urgent. Your PPC dashboard has red numbers. Your inventory is running low. Your supplier wants to renegotiate. Copy always loses to fires.
But here’s the maths: if your listing converts at 12% and a rewrite gets it to 15%, that’s a 25% increase in sales from the same traffic. No extra ad spend. No new keywords. Just better copy on the page people already land on.
“I don’t know what to change”
This is the real blocker. Most sellers can feel their listing is weak but can’t pinpoint why. Is it the title? The bullets? The description? All of them? Without data, you’re guessing – and guessing means either changing nothing or changing everything and hoping it works.
That’s what the score and the complaint predictions are for. They tell you exactly which lines are creating doubt and what’s missing. Not a vague “improve your copy” recommendation. Specific, actionable gaps.
“Testing is expensive and slow”
Traditional A/B testing (Manage Your Experiments in Seller Central) takes 4-8 weeks, requires traffic volume most products don’t have, and only tests one variable at a time. If you have 5 things wrong with your listing, that’s 5 months of sequential testing.
Predictive analysis gives you all the feedback at once. Fix everything in one sitting, publish the improved version, and use your A/B testing budget to verify the single biggest change rather than running a discovery process.
“My product sells fine as-is”
If BSR is stable, reviews are good, and margins are healthy – maybe it is fine. But “fine” at what conversion rate? If your listing converts at 10% and the category average is 15%, you’re paying 50% more per sale in PPC to compensate. That’s a margin leak that doesn’t show up in your P&L as “bad listing copy.”
The desk organiser in this post has 4,374 reviews at 4.6 stars. It’s clearly selling. But its listing score was 57/100. That means 43% of the maximum possible purchase confidence is being left on the table. At $67 per unit and let’s say 500 sessions/day, even a 2% conversion rate improvement represents thousands in monthly revenue.
The sellers who win on Amazon aren’t the ones with perfect products. They’re the ones who remove every unnecessary friction point between “this looks good” and “Add to Cart.” Your listing is the last mile of that journey.
“AI can rewrite my bullets for free”
This is the most common objection and the desk organiser example shows exactly why it fails. ChatGPT, Claude, and other AI tools can absolutely rewrite your bullets. But without shopper simulation, they have no way to know whether the rewrite is better or worse.
In our desk organiser test, the AI rewrite scored lower than the original. It introduced irrelevant language about “battery and charging” and “sweat and weather” – concepts that have nothing to do with a desk organiser. A seller who blindly pasted an AI rewrite would have made their listing worse without knowing it.
The value isn’t in the rewrite. It’s in the score. The score tells you whether to keep what you have, what specifically to change, and whether the change actually improved things. Without that feedback loop, you’re optimising blind.
“I’ll just look at my competitor’s listings”
Competitive analysis is useful for understanding what exists in your category. It’s useless for understanding what works. You can see what a competitor wrote. You can’t see their conversion rate.
A listing with 10,000 reviews might have mediocre copy that’s being carried by advertising spend, brand recognition, or first-mover advantage. Copying their approach assumes their listing is good – when often it’s just established. The shin guards in this post (#28 in category) had strong sales despite weak copy. Anyone copying that listing would be copying the weaknesses along with the strengths.
How the listing score works
A listing score isn’t a subjective quality rating. It measures one thing: how likely a simulated shopper panel is to buy after reading your listing copy.
50 AI-modelled shoppers evaluate your listing independently. Each one has a different demographic profile, shopping context, and set of priorities – the same diversity you’d get from real traffic. They report what they’d praise in a review, what they’d complain about, and whether they’d hit “Add to Cart.”
The score aggregates those signals into a single number:
- 80-100: Strong purchase confidence. Few hesitations, clear value communication. Most shoppers would buy without checking alternatives.
- 60-79: Decent but with gaps. Shoppers are interested but have unanswered questions that might send them back to search results.
- 40-59: Significant friction. Multiple points of confusion, missing information, or misaligned messaging. Traffic is coming but not converting at its potential.
- Below 40: Major problems. The listing is actively creating doubt – exaggerated claims, contradictory information, or critical missing details.
The three listings in this post scored 72, 53, and 57. All in the “significant friction” to “decent with gaps” range. All selling despite their copy, not because of it. All with specific, fixable problems.
The score is directional, not absolute. A 57 doesn’t mean “57% of shoppers will buy.” It means your listing is capturing 57% of the maximum purchase confidence possible given your product. The remaining 43% is being lost to specific copy problems that the tool identifies.
The real cost of a weak listing (with maths)
Before we talk solutions, let’s quantify what a 57/100 listing actually costs.
Take the desk organiser: $67.02 price, let’s assume a conservative 200 sessions per day and a 12% conversion rate. That’s 24 orders/day, or roughly $1,608 in daily revenue.
Now, if optimised copy moved conversion from 12% to 14% – a modest improvement from removing the exaggerated claims and adding dimensions – that’s 28 orders/day. An extra 4 orders at $67 is $268/day, or $8,040 per month in additional revenue. From the same traffic.
This is why pricing strategy conversations often miss the point. Sellers spend weeks deciding whether to price at $64.99 or $67.99, while their listing copy silently leaks 10-20% of potential conversions. You can’t price your way out of a trust gap.
The counterargument is “but I don’t know if my conversion rate would actually improve.” That’s fair. But consider the downside: you spend $4.90 (one credit) to find out exactly what’s weak in your listing. If the audit says your copy is already strong (as it sometimes does), you’ve confirmed that and can focus elsewhere. If it finds problems, you have a specific list of what to fix. Either way, you stop guessing.
What to do with this information
If you recognise your listing in the patterns above – incomplete information, feature-first language, cluttered copy that buries the reason to buy – you have three options:
Option 1: Fix it yourself. Re-read your bullets from the perspective of someone who has never seen your product and is comparing it to two alternatives on the same search page. Does your listing answer “why this one?” in the first 3 seconds? Can a shopper find the one piece of information they need to feel confident buying? If you’re not sure, ask a friend who hasn’t seen your product to read your listing and tell you what’s missing.
Option 2: Hire a copywriter. Good Amazon copywriters charge $200-500 per listing. They’ll improve the language, but without shopper data, they’re still guessing about what specifically is losing you sales. The desk organiser example shows why: the “right” rewrite can actually make things worse if it introduces irrelevant claims or removes the concrete details shoppers are looking for.
Option 3: Get the data first, then rewrite. A listing audit shows you exactly what shoppers are thinking – the praise, the complaints, the gaps – so any rewrite (yours or a copywriter’s) hits the right targets. This is the approach that compounds: each credit gives you a specific list of what to fix, so you’re not throwing money at generic “listing optimisation” without knowing what’s actually broken.
The sellers who improve fastest are the ones who combine Options 1 and 3: get the audit data, fix it themselves using the specific recommendations, and verify the improvement with a second pass. Total cost: $9.80 (two credits). Total time: one afternoon. Total guessing: zero.
Before and after: what a fixed listing looks like
To make this concrete, here’s what the shin guards’ first bullet point looks like before and after applying the audit recommendations.
Before (current listing):
【Package Contents & All-Around Protection】- Includes 1 pair of soccer shin guards + 1 pair of soccer socks. The shin guards feature high-impact hard front plates for reliable shin protection, while the matching long socks provide full calf coverage and extra defense against bumps and collisions during football games and training.
After (addressing the “sizing confusion” complaint):
Complete Starter Kit for Ages 3-15: Includes 1 pair of shin guards + 1 pair of long soccer socks. Three sizes available – S fits 3’5″-3’9″ (ages 3-6), M fits 3’9″-4’4″ (ages 6-10), L fits 4’4″-5’0″ (ages 10-15). Hard PP shell and EVA padding protect during games and training. The socks add full calf coverage for extra confidence on the pitch.
What changed:
- Opened with the size information – directly addressing the #1 shopper complaint
- Removed the emoji brackets – cleaner, easier to scan
- Added specific height/age mapping – removes the “which size?” hesitation
- Kept the protection claims – these were working, don’t fix what isn’t broken
- Added “confidence” – emotional benefit, not just functional
The information was already accurate. The product was already good. The only change was answering the question the shopper was actually asking: “Will this fit my kid?”
That’s what a listing audit does. It doesn’t reinvent your product story. It identifies the one question that’s creating hesitation and makes sure your copy answers it.
How the three approaches to listing optimisation compare
| Approach | Cost | Time | What you learn | Risk |
|---|---|---|---|---|
| DIY rewrite | Free | 1-2 hours | Nothing – you’re guessing what’s wrong | High – might make it worse |
| Hire a copywriter | $200-500/listing | 3-7 days | Better language, but no data on what specifically was losing sales | Medium – better copy but maybe fixing the wrong problem |
| Amazon A/B test | Free (if traffic is sufficient) | 4-8 weeks per variable | Which of two options converts better | Low risk, but painfully slow and requires existing traffic |
| Listing audit first, then fix | $4.90/listing | 5 minutes + rewrite time | Exactly what shoppers like, what creates doubt, and what’s missing | Very low – data-informed changes, verified before publishing |
The optimal workflow combines these:
- Audit your current listing (5 minutes, $4.90)
- Fix the specific problems identified (30-60 minutes, free)
- Verify the fix improved the score (5 minutes, $4.90)
- A/B test the biggest change if you want statistical proof (4-8 weeks, free)
Most sellers skip straight to step 4 without knowing what to test. Or they hire a copywriter for step 2 without knowing what’s actually broken. The audit data makes every downstream step more effective.
Same product. Better listing. More sales.
Find out which version of your product listing converts best – before you publish.
FAQ
How long does a listing audit take?
From paste to full report: under 5 minutes. The AI shoppers evaluate your listing in parallel, not sequentially like a focus group.
Does this work for any product category?
Yes. The shopper simulation adapts to the category context. A buyer evaluating headphones has different priorities than one buying kids’ sports gear – the model accounts for this.
What if my listing already has good reviews?
Reviews reflect past buyers. Your listing score reflects future ones. A product with strong reviews but weak copy is leaving money on the table – the reviews are carrying the conversion that your copy should be handling.
Is this the same as an Amazon keyword tool?
No. Keyword tools tell you what to rank for. A listing audit tells you what to say once shoppers arrive. They’re complementary – keywords get traffic, copy converts traffic.
How is this different from ChatGPT rewriting my bullets?
ChatGPT can rewrite copy, but it can’t tell you which parts are losing sales or predict how shoppers will react. It doesn’t know that “sizing confusion” is your listing’s biggest weakness or that “complete set” is your strongest selling point. The audit gives you the diagnosis; the rewrite is the prescription. As the desk organiser example showed, an AI rewrite without feedback can actually make things worse.
What does a “credit” get me?
One credit = one complete listing analysis: score, predicted rating, likely praise, likely complaints, expectation gaps, and platform-ready rewrites for title, bullets, and description. You can run it on your current listing to see what’s weak, then run it again on your improved version to verify the fix worked.
Can the score go down after I make changes?
Yes – and that’s the point. If you make changes that confuse shoppers or introduce irrelevant claims, the score drops. This is what happened with the desk organiser rewrite: the AI-generated version scored 7 points lower because it introduced language about batteries and weather resistance that had nothing to do with the product. The tool caught that before it went live.
How accurate is the predicted star rating?
Across our calibration testing, the predicted rating lands within 0.3 stars of actual reviews on average. It’s directional, not exact – think of it as “shoppers will probably feel 3-4 star about this” rather than “you’ll get exactly 3.7 stars.” The value is in the relative comparison: is your revised listing likely to get a higher or lower reaction than your current one?
Does this replace A/B testing?
No – it precedes it. A/B testing (Amazon’s Manage Your Experiments) tells you which version wins with real traffic. But it requires 4-8 weeks, significant traffic volume, and can only test one variable at a time. A listing audit tells you what to fix before you test, so your A/B test compares “good vs better” rather than “broken vs slightly less broken.” Use the audit to identify problems, fix them, then use A/B testing to verify the single highest-impact change.
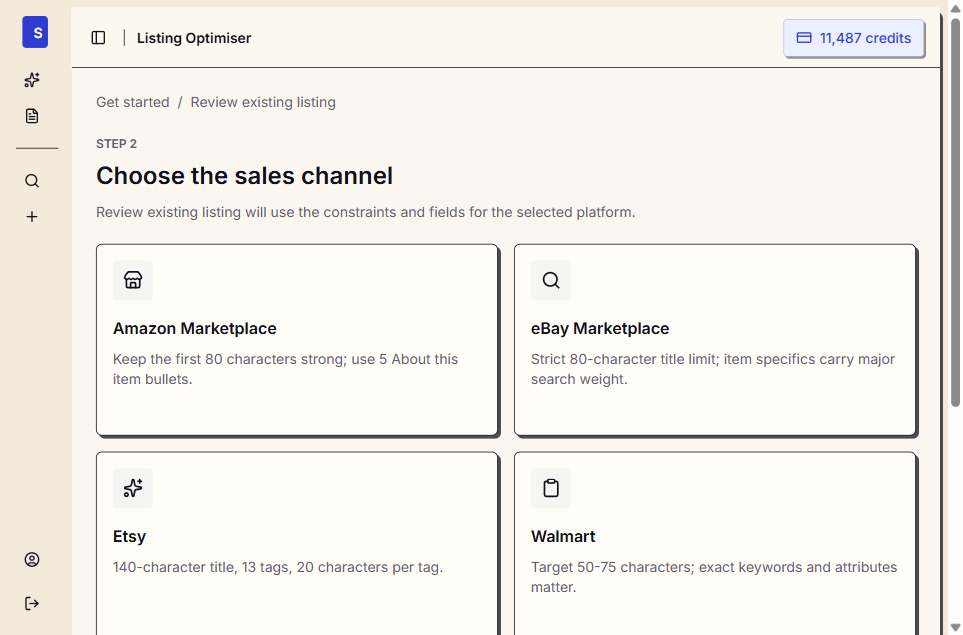
I sell on multiple platforms. Does the advice change?
The shopper psychology is similar across Amazon, eBay, Walmart, and Shopify – buyers everywhere want confidence before they commit. But the formatting rules differ significantly. Amazon allows 200-character titles and 5 bullets. eBay has strict 80-character titles. Etsy uses tags and attributes differently. The tool adapts its recommendations to the platform constraints you select.
All screenshots in this post are from real listing analyses run through the Saucery listing optimiser. No edits, no cherry-picking – these are the actual results.
Subscribe for F&B Consumer Insights
Data-driven insights on food & beverage consumer preferences, straight to your inbox.